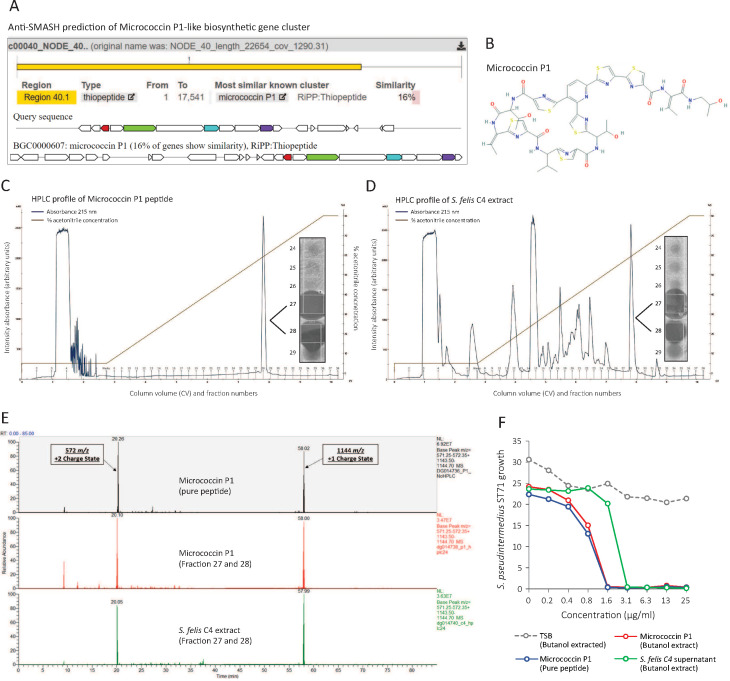
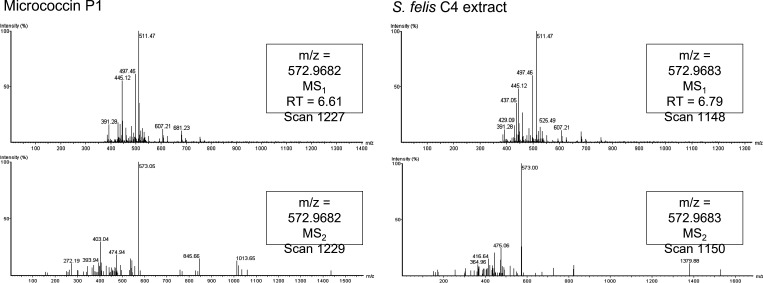
Figure 4. Identification of a micrococcin P1-like antimicrobial in S. felis C4 extract.
(A) Prediction of a biosynthetic gene cluster (BCG) in the S. felis C4 genome that has predicted similarity to a micrococcin P1 thiopeptide-encoding BCG. (B) Micrococcin P1 chemical structure downloaded from PubChem. (C) HPLC chromatogram of pure micrococcin P1 showing a single major peak eluted at 59 % acetonitrile into fractions 27 and 28. Inset image shows antimicrobial activity of fractions 27 and 28 against S. pseudintermedius ST71. (D) HPLC chromatogram of S. felis C4 extract showing a single major peak eluted at 59 % acetonitrile into fractions 27 and 28. Inset image shows antimicrobial activity of fractions 27 and 28 against S. pseudintermedius ST71. (E) Mass spectrometry chromatogram of similar masses and charge states generated from the synthetic peptide micrococcin P1 (top panel), HPLC fractions 27 and 28 from micrococcin P1 (middle panel) and HPLC fractions 27 and 28 from S. felis C4 extract (bottom panel). (F) Antimicrobial activity of negative control TSB, S. felis C4 supernatant and micrococcin P1 (before or after extraction with n-butanol) against S. pseudintermedius ST71 (OD600 nm) after 18 hr. Representative of two independent butanol extractions and antimicrobial assays.


