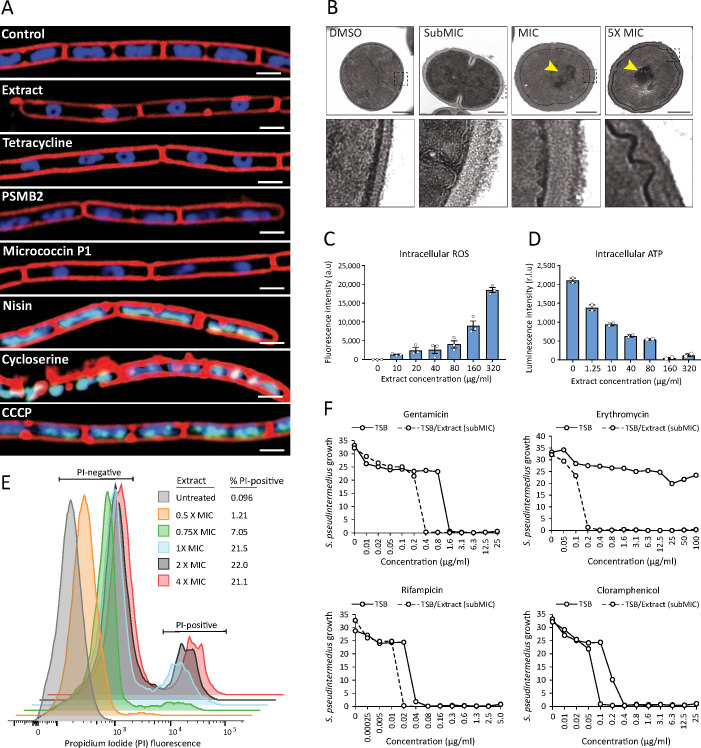
Figure 5. S. felis C4 antimicrobials target the bacterial cell membrane inhibit protein translation.
(A) Cytological profiles of B. subtilis PY79 upon treatment with 1 X MIC of S. felis C4 extract, tetracycline, PSMβ2, micrococcin P1, nisin, cycloserine, CCCP (carbonyl cyanide m-chlorophenylhydrazine) and DMSO control. Fluorescent microscopy images were taken 2 hr post-treatment, except for cycloserine, nisin and CCCP which were at 30 m post-treatment. The cell membrane was stained red with FM4-64, DNA-stained blue with DAPI, or green with SYTOX when the integrity of the membrane was compromised. Scale bar = 2 μm. (B) TEM images of S. pseudintermedius ST71 after 1 hr treatment with S. felis C4 extract or DMSO control at the indicated concentrations. Yellow arrows highlight areas of condensed DNA. Lower image panels represent higher magnification of regions highlighted by dashed black boxes. Scale = 250 nm. (C) Total ROS accumulation in S. pseudintermedius ST71 after 1 hr treatment in increasing concentrations of S. felis C4 extract. Error bars indicate SEM. (D) Total intracellular ATP accumulation in S. pseudintermedius ST71 after 1 hr treatment in increasing concentrations of S. felis C4 extract. Error bars indicate SEM. (C–D) representative of two separate experiments. (E) Flow cytometric LIVE/DEAD viability assay and quantification of SYTO9-positive S. pseudintermedius ST71 that were propidium iodide-positive (PI) or PI-negative at 4 hr post-treatment with increasing concentrations of S. felis C4 extract. Representative of two independent experiments. (F) Growth of S. pseudintermedius ST71 (OD600 nm) in TSB or TSB supplemented with a sub inhibitory 0.25 X MIC (0.4 μg/ml) of S. felis C4 extract after 18 hr incubation with increasing concentrations of rifampicin, gentamicin, erythromycin or cloramphenicol. Representative of three independent experiments.

