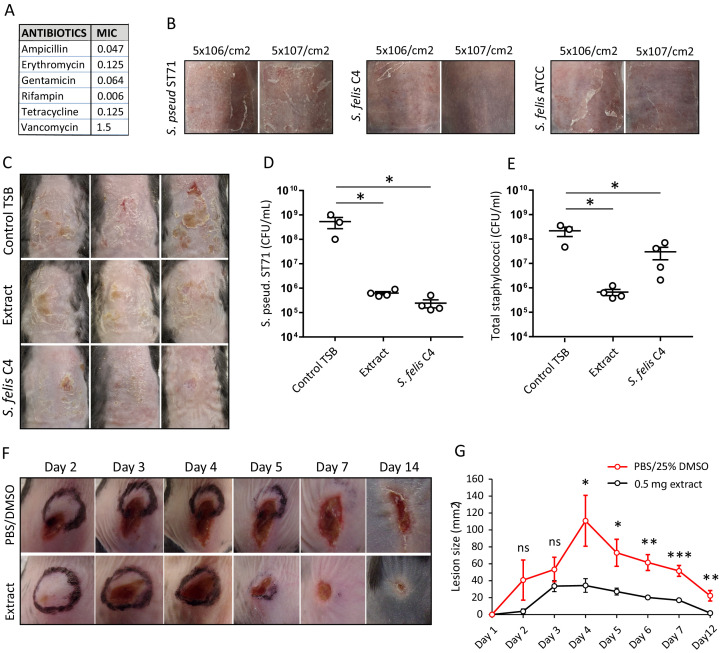
Figure 6. Live bacteriotherapeutic intervention with S. felis C4 protects against S. pseudintermedius colonization in mice.
(A) Minimum inhibitory concentrations (MIC) of the indicated antibiotics against S. felis C4. (B) Representative images of the dorsal skin of 8–10 week-old SKH1 mice 3 days post-challenge with live S. felis C4, S. pseudintermedius ST71 (S. pseud ST71) or S. felis ATCC (49168), inoculated at the indicated amounts. n = 2, per treatment group. (C–E) 5 × 10⁷ CFU/cm2 of S. pseudintermedius ST71 was applied onto the back skin of C57BL/6 mice for 48 hr and challenged with TSB, S. felis C4 extract (1 mg) or live S. felis C4 (5 × 10⁷ CFU/cm2) for 72 hr. Post-treatment, mouse back skin was photographed (C) and swabbed to enumerate S. pseudintermedius ST71 CFU on selective Baird-Parker egg yolk tellurite agar (D) or total staphylococci CFU on selective mannitol-salt agar plates (E). n = 3 for TSB and n = 4 for extract and S. felis C4. Error bars indicate SEM. One-way ANOVA with multiple comparisons (Dunnett’s correction) was performed. p values: *p < 0.05; (F–G) At day 0, 1 × 10⁷ CFU of S. pseudintermedius ST71 was intradermally injected into the back skin of 8–10 week-old C57BL/6 mice and at 1 hr post-infection two inoculations of S. felis C4 extract (250 μg) or PBS/25 % DMSO control were injected adjacent to the infection site. (F) Representative images of S. pseudintermedius ST71-induced dermonecrosis over time after receiving control PBS/DMSO or S. felis C4 extract. (G) Quantification of lesion size (mm2) over time as measured by L x W of lesions. n = 4 for DMSO/PBS and n = 5 for extract. Error bars indicate SEM. A two-tailed, unpaired Student’s t-test was performed. p values: *p < 0.05; **p < 0.01; ***p < 0.001.

