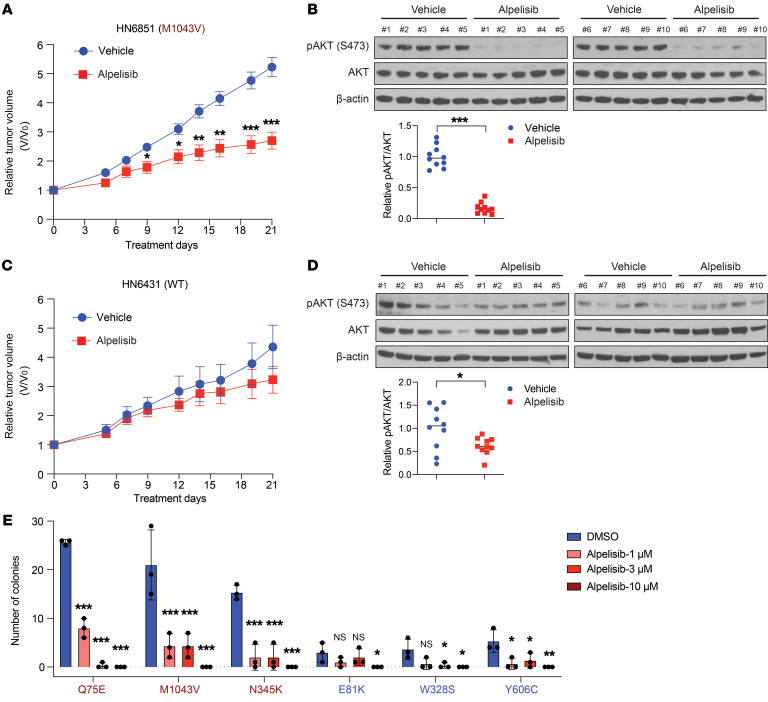
Figure 5. Response to alpelisib in HNSCC preclinical models expressing noncanonical PIK3CA mutations.
(A) Tumor growth curve of an HNSCC PDX (HN6851) harboring the noncanonical M1043V PIK3CA mutation. Mice were dosed with alpelisib (25 mg/kg, p.o.) daily for 21 days (n = 12 tumors per group). Data are shown as the mean ± SEM. For statistical assessment of tumor growth, the tumor volumes were compared between vehicle- and alpelisib-treated groups at multiple time points. *P < 0.05, **P < 0.01, ***P < 0.001 for 1-tailed Student’s pairwise t test. (B) Immunoblot analysis of AKT activation in the HN6851 PDX tumors. Tumor samples were collected 3 hours after the last dosing. AKT activation was detected by phosphorylation of S473; β-actin, loading control. The fold-change in the ratio of pAKT/(total AKT) expression in vehicle- and alpelisib-treated tumors was quantified by densitometry and normalized to the mean value in vehicle-treated tumors. ***P < 0.001 for 1-tailed Student’s pairwise t test. (C) Tumor growth curve of an HNSCC PDX (HN6431) with WT PIK3CA. Mice were dosed with alpelisib (25 mg/kg, p.o.) daily for 21 days (n = 12 tumors per group). Data were presented as indicated in A. (D) Immunoblot analysis of AKT activation in the HN6431 PDX tumors. Tumor samples were collected and analyzed as indicated in B. *P < 0.05 for 1-tailed Student’s pairwise t test. (E). Alpelisib sensitivity in colony formation assay. Isogenic PCI-52-SD1 expressing the indicated proteins were treated with vehicle (DMSO) or alpelisib (1, 3, 10 μM) for 3 weeks followed by crystal violet staining. The colonies were quantified using ImageJ (n = 3). Data are shown as the mean ± SD. *P < 0.05, **P < 0.01, ***P < 0.001, NS ≥ 0.05 for 1-tailed Student’s pairwise t test. The experiment was repeated twice with similar results.

