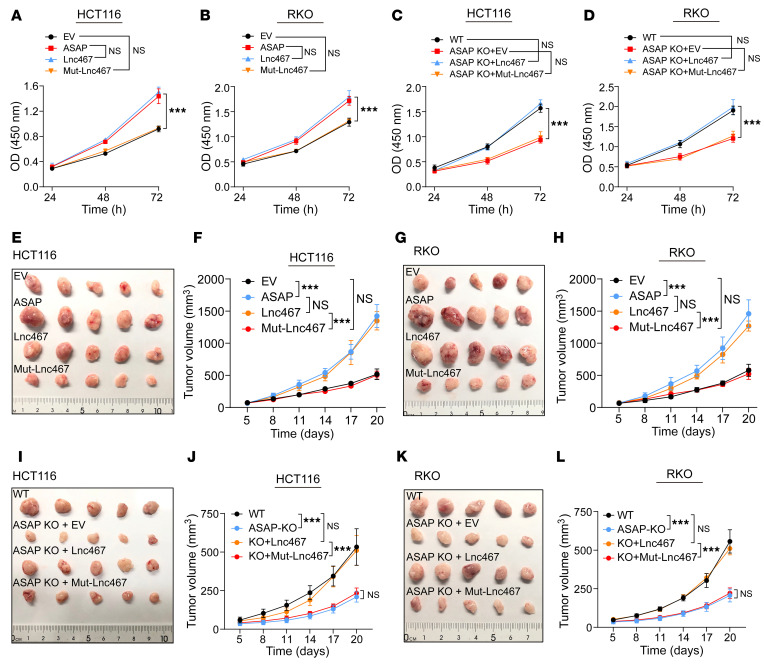
Figure 3. ASAP promotes CRC cell proliferation in vitro and in vivo.
(A–D) The CCK-8 assay was used to determine the proliferation rate of indicated cells. Data are presented as mean values ± SD. n = 3 biologically independent experiments. Two-way ANOVA analysis. ***P < 0.001. (E and F) Xenograft mouse model using EV control or ASAP, LINC00467-overexpressing (Lnc467), or Mut-LINC00467–overexpressing (Mut-Lnc467) HCT116 cells. In vivo generated tumors (E) and analyses of tumor growth and volume (F) are shown. Data are presented as mean ± SD from n = 5 mice per group. Two-way ANOVA. ***P < 0.001. (G and H) Xenograft mouse model using EV control or ASAP, LINC00467-overexpressing (Lnc467), or Mut-LINC00467–overexpressing (Mut-Lnc467) RKO cells. In vivo generated tumors (G) and analyses of tumor growth and volume (H) are shown. Data are presented as mean ± SD from n = 5 mice per group. Two-way ANOVA analysis. ***P < 0.001. (I and J) Xenograft mouse model using WT, ASAP-KO, LINC00467-restored (Lnc467), or Mut-LINC00467–restored (Mut-Lnc467) HCT116 cells. In vivo generated tumors (I) and analyses of tumor growth and volume (J) are shown. Data are presented as mean ± SD from n = 5 mice per group. Two-way ANOVA analysis. ***P < 0.001. (K and L) Xenograft mouse model using WT, ASAP-KO, LINC00467-restored (Lnc467), or Mut-LINC00467–restored (Mut-Lnc467) RKO cells. In vivo generated tumors (K) and analyses of tumor growth and volume (L) are shown. Data are presented as mean ± SD from n = 5 mice per group. Two-way ANOVA analysis. ***P < 0.001.

