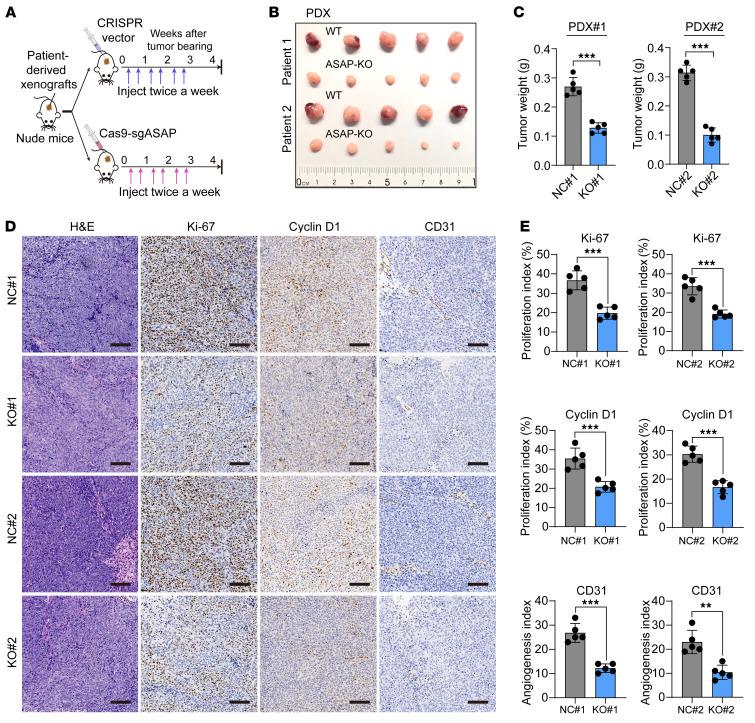
Figure 8. Targeting ASAP suppresses the growth of PDXs.
(A) Schematic diagram showing the CRISPR/Cas9 system–based strategy to disrupt ASAP of PDXs. Three days after tumor inoculation, mice received 3 weeks of intratumoral injection of either ASAP-targeted CRISPR/Cas9 (Cas9-sgASAP) vector plus delivery buffer (purple arrows) or CRISPR v2 vector plus delivery buffer (blue arrows). (B and C) In vivo generated tumors (B) and tumor weight (C) of PDX models are shown. Independent samples, 2-sided Student’s t test. ***P < 0.001. (D) Representative IHC staining in tumors from PDX model are shown. Scale bars: 200 μm. (E) The relative intensities of IHC (Figure 8D) were quantified by ImageJ software (version 1.51) in 10 random fields from 5 tumors in each group. Data are presented as mean ± SD from n = 5 tumor samples per group. Independent samples, 2-sided Student’s t test. **P < 0.01; ***P < 0.001.

