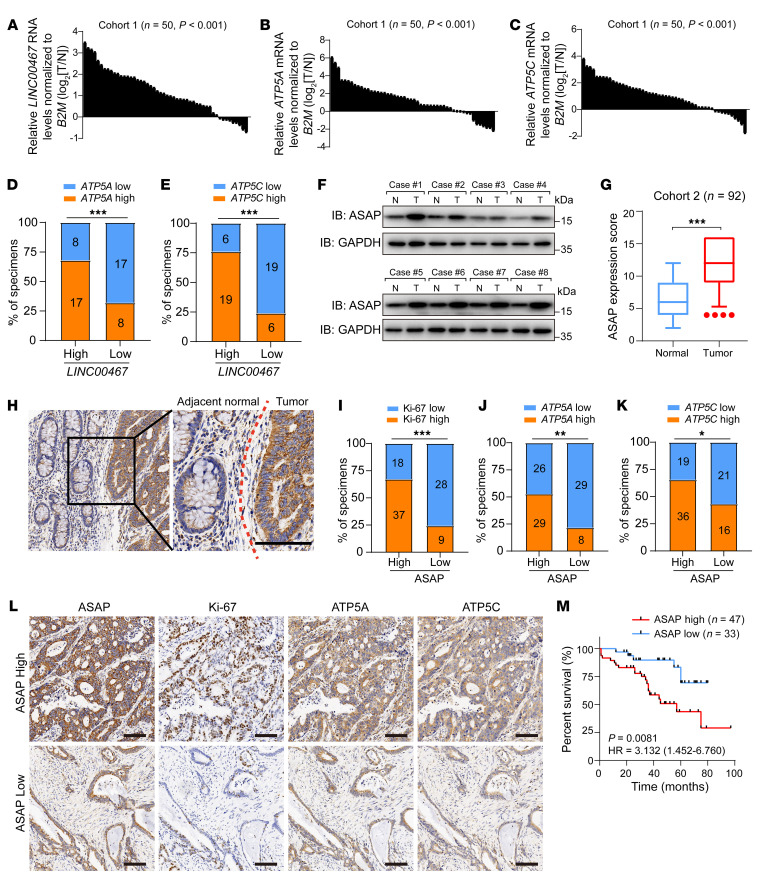
Figure 9. Expression of ASAP and LINC00467 predicts poor outcomes in CRC.
(A–C) RNA levels of LINC00467 (A), ATP5A (B), and ATP5C (C) in CRC tissues and matched nontumor tissues in cohort 1 (n = 50) were detected by RT-qPCR in 3 independent experiments. Paired samples, 2-sided Student’s t test. (D and E) Percentages of specimens showing low or high LINC00467 expression related to levels of ATP5A (D) and ATP5C (E). Numbers in the bars indicate samples represented by each square. χ2 test. ***P < 0.001. (F) ASAP levels in randomly selected CRC and noncancerous tissues were detected by Western blot. Data are representative of 3 independent experiments. (G) Quantification of ASAP protein expression by scoring immunohistochemistry staining in CRC of cohort 2. Bounds of boxes show the 25th and 75th percentiles, and the central lines in the boxes represent the median value. Whiskers show 5th to 95th percentiles. Outlying values, 4, 4, 4, 4 (tumor). Paired-samples 2-sided Student’s t test. ***P < 0.001. (H) Representative images of ASAP staining on CRC and adjacent normal tissues. The red dotted line indicates the boundary between tumor and normal tissue. Scale bar: 200 μm. (I–K) Percentages of specimens showing low or high ASAP expression related to levels of Ki-67 (I), ATP5A (J), and ATP5C (K). Numbers in the bars indicate samples represented by each square. χ2 test. *P < 0.05; **P < 0.01; ***P < 0.001. (L) ASAP levels were significantly associated with expression of Ki-67, ATP5A, and ATP5C in primary human CRC specimens (cohort 2, n = 92). Two representative cases are shown. Scale bars: 200 μm. (M) CRC patients with follow-up data in cohort 2 (n = 80) were divided into 2 groups according to the expression of ASAP, and the overall survival curve was generated with Kaplan-Meier analysis and log-rank test.

