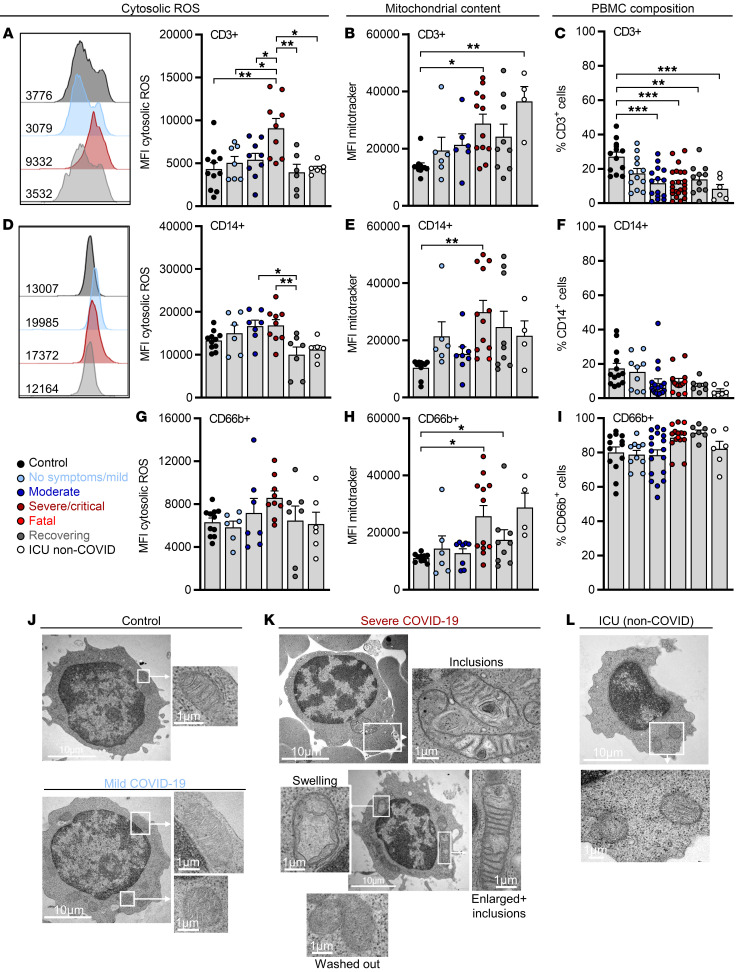
Figure 1. ROS accumulation in T cells from progressed COVID-19 patients is reversible and correlates with changes in mitochondrial mass and architecture.
Blood was drawn and processed the same day. Erythrocytes were removed and immune cells were stained for population-specific surface markers. The results show comparisons between specified COVID-19 patient subgroups, critically ill non–COVID-19 patients (ICU non-COVID), and healthy controls. (A) ROS levels, (B) mitochondrial content in CD3+ T cells, and (C) percentage of CD3+ cells among viable cells. MFI, median fluorescence intensity. (D) Cytosolic ROS levels, (E) mitochondrial content in CD14+ monocytes, and (F) proportion of CD14+ monocytes among the CD11b+ myeloid population. (G) Cytosolic ROS levels, (H) mitochondrial content in CD66b+ granulocytes, and (I) proportion of CD66b+ granulocytes among CD11b+ myeloid cells. Shown are representative histograms of ROS staining in CD3+ and CD14+ cells of each group. Shown is the median + SEM, and each symbol represents 1 donor. *P < 0.05; **P < 0.01; ***P < 0.001 by 1-way ANOVA with Bonferroni’s multiple comparisons test. Analysis of mitochondrial structure by electron microscopy in lymphocytes from healthy control cells, a COVID-19 patient with mild symptoms (J), of 2 COVID-19 patients with severe symptoms (K), and a critically ill non–COVID-19 patient (L). Scale bars: 10 μm. Shown are representative examples.

