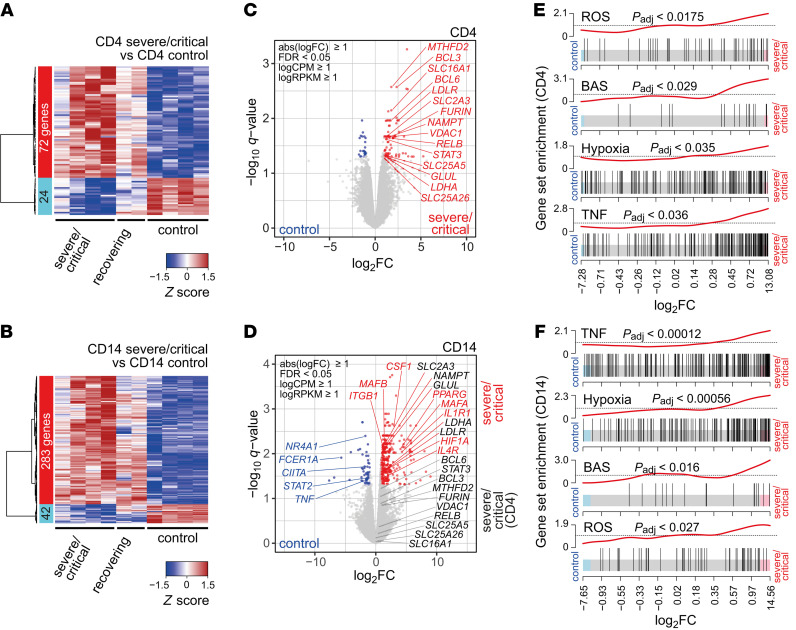
Figure 2. ROS-inducible and basigin-related gene expression in immune cells from patients with severe COVID-19.
Blood samples from COVID-19 patients (4 ICU, 2 recovering) and 4 healthy controls were enriched for PBMCs and cryopreserved. Cells were sorted according to specific surface markers, and RNA was extracted and subjected to stranded total RNA sequencing. Heatmaps presenting hierarchically clustered and scaled expression data of CD4+ T cells (A) or CD14+ monocytes (B). Shown are differentially expressed genes in severe/critical patients versus controls filtered for absolute logFC > 1, logCPM and logRPKM > 1, and FDR < 0.05. Each column corresponds to an individual. The list and expression values of all regulated genes are in the supplemental material as well as a list of all read counts. Volcano plots of significantly up- or downregulated genes (red or blue) in CD4+ T cells (C) or CD14+ monocytes (D) of severe/critical patients with additional genes upregulated in CD4+ T cells but not in CD14+ monocytes (black). Genes with known function in transcriptional or metabolic processes are highlighted. Gene set enrichment analysis of candidate HALLMARK pathways in CD4+ T cells (E) or CD14+ monocytes (F). HALLMARK pathways include REACTIVE_OXYGEN_SPECIES_PATHWAY (ROS), TNFA_SIGNALING_VIA_NFKB (TNF), HYPOXIA, and basigin-interacting proteins (BAS), defined by STRING analysis (see Supplemental Figure 2). Enrichment P values were adjusted for multiple testing using Benjamini-Hochberg correction.

