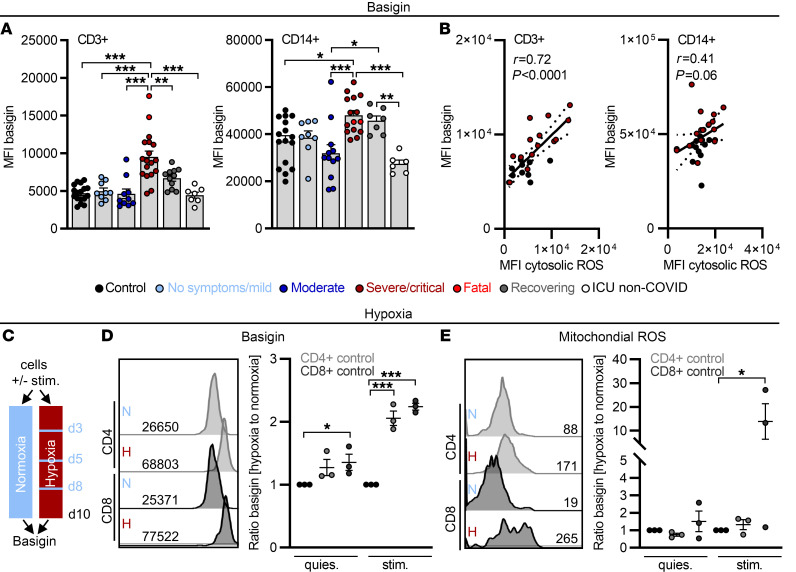
Figure 3. Elevated basigin expression correlates with cytosolic ROS in severe/critical COVID-19 patients and can be triggered by hypoxia.
(A–E) Blood was drawn and processed the same day. (A) Basigin expression determined on CD3+ cells and CD14+ cells. MFI, median fluorescence intensity. (B) Correlation of ROS and basigin in CD3+ and CD14+ cells, calculated by Spearman’s r, with single data points for controls in black and severe/critical patients in red. (C) Control samples were cultured with (stim.) or without (quies.) anti-CD3/anti-CD28 Dynabeads in normoxia or hypoxia for 10 days interrupted by 1-hour periods of normoxia on days 3, 5, and 8. On day 10, basigin expression (D) and mitochondrial ROS (E) were analyzed. Values normalized to corresponding treatment under normoxia are displayed. Each symbol represents 1 donor. In A, D, and E, summarized data are displayed as mean + SEM. *P < 0.05; **P < 0.01; ***P < 0.001 by 1-way ANOVA with Bonferroni’s multiple comparisons test. Representative histograms are shown in D and E.

