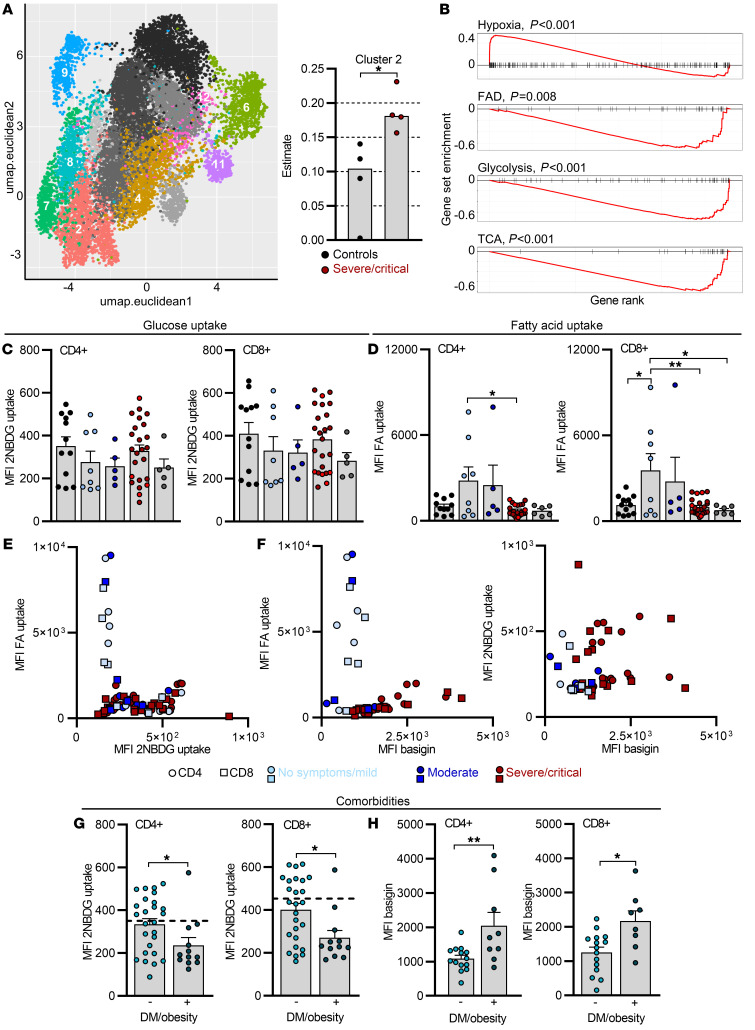
Figure 4. Increased fatty acid uptake is limited to T cells from mild COVID-19 and correlates with low basigin expression.
(A) Leiden clustering was used to identify 14 unique clusters in publicly available single-cell RNA-seq data for CD4+ COVID-19 PBMCs, and 8 were detected in CD4+ T cell bulk sequencing data (Figure 2, A, C, and E) using digital tissue deconvolution. These are shown in colors in the UMAP embedding, while clusters estimated as zero are in gray scale. For better clarity, only 10% of the used data are shown. Cluster 2 estimates in CD4+ T cells from controls and severe/critical COVID-19 patients are shown on the right. (B) Gene set enrichment analysis for selected gene sets. The horizontal axis shows the rank of each gene in cluster 2 compared to all others. Vertical marks show the position of a gene from the gene set in the ranking, and the red lines show either over (positive values) or under representation (negative values). FAD, fatty acid degradation. (C–H) Blood was drawn and processed the same day. Determination of 2NBDG uptake (C) and BODIPY 500/510 C1, C12 uptake (D) in CD4+ and CD8+ T cells, and correlation of both from corresponding measurements (E). FA, fatty acid; MFI, median fluorescence intensity. (F) Fatty acid uptake and 2NBDG uptake in CD4+ and CD8+ T cells plotted against basigin expression from the same sample. Comparison of 2NBDG uptake (G) and basigin expression (H) in CD4+ and CD8+ T cells in diabetic (DM)/obese (+) versus nondiabetic/obese (–) COVID-19 patients. Each symbol represents 1 donor. In C, D, G, and H, summarized data are displayed as mean + SEM. *P < 0.05; **P < 0.01 by 1-way ANOVA with Bonferroni’s multiple comparisons test (C and D) or Mann-Whitney U test (G and H).

