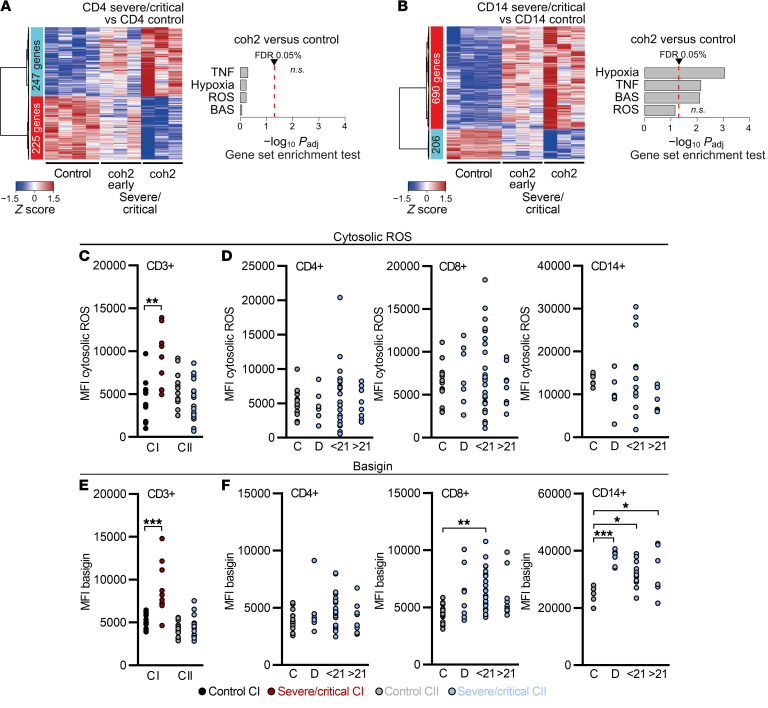
Figure 6. Dexamethasone mitigates ROS accumulation and basigin expression and related gene signatures in COVID-19 patient T cells.
(A and B) Cohort 2 (coh2) blood samples were enriched for PBMCs, cryopreserved, and processed (see Figure 2). Heatmaps presenting hierarchically clustered and scaled expression data (filtered for absolute logFC > 1, logCPM and logRPKM > 1, and FDR < 0.05) and gene set enrichment analysis of the HALLMARK pathways, as analyzed in CI (see Figure 2, E and F) of CD4+ T cells (A) or CD14+ monocytes (B). Shown are differentially expressed genes in severe/critical patients taken in the first 14 days after dexamethasone cessation (coh2 early) or beyond (coh2 late, time point comparable to CI; 3 samples each time point, 2 paired early and late patient samples). Displayed is the comparison with CI controls (see Figure 2, A–F). Each column corresponds to an individual sample. A list of all read counts can be found in the supplemental material. (C–F) Blood samples were drawn and processed the same day. (C) Cytosolic ROS levels of CD3+ T cells from controls and severe/critical patients of CI and CII analyzed in the same period of time after ICU hospitalization (see Figure 5A). MFI, median fluorescence intensity. (D) Cytosolic ROS levels in CD4+ and CD8+ T cells and CD14+ monocytes of CII grouped according to time point analyzed. (E) Basigin expression of CD3+ T cells from controls and severe/critical patients of CI and CII analyzed in the same period of time after ICU hospitalization (see Figure 5A). Basigin expression of CD4+ and CD8+ T cells and CD14+ monocytes of CII grouped according to time point analyzed (F). Each symbol in C–F represents 1 donor. *P < 0.05; **P < 0.01; ***P < 0.001 by Mann-Whitney U test (C and E) or 1-way ANOVA with Bonferroni’s multiple comparisons test (D and F).

