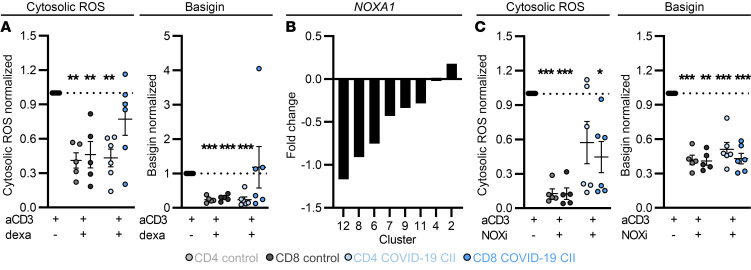
Figure 7. Dexamethasone and NOX inhibition mitigate T cell ROS accumulation and basigin expression in vitro.
(A and C) Blood of donors was drawn and processed the same day. PBMCs were isolated and treated as indicated (for concentrations see Methods). (A) After 72 hours, PBMCs were stained for CD4 and CD8 and cytosolic ROS and basigin levels were analyzed. Data were normalized to anti-CD3 (aCD3) stimulation of the respective donor. (B) Log(fold change) of expression estimates for NOXA1 were determined for each cluster (as in Figure 4A and Supplemental Figure 4A). (C) PBMCs were processed as in A. Data normalized to anti-CD3 stimulation of the respective donor are shown. Summarized data are displayed as mean + SEM, with each symbol representing 1 donor. *P < 0.05; **P < 0.01; ***P < 0.001 by 1-way ANOVA with Bonferroni’s multiple comparisons test (A and C; T cell population specific).

