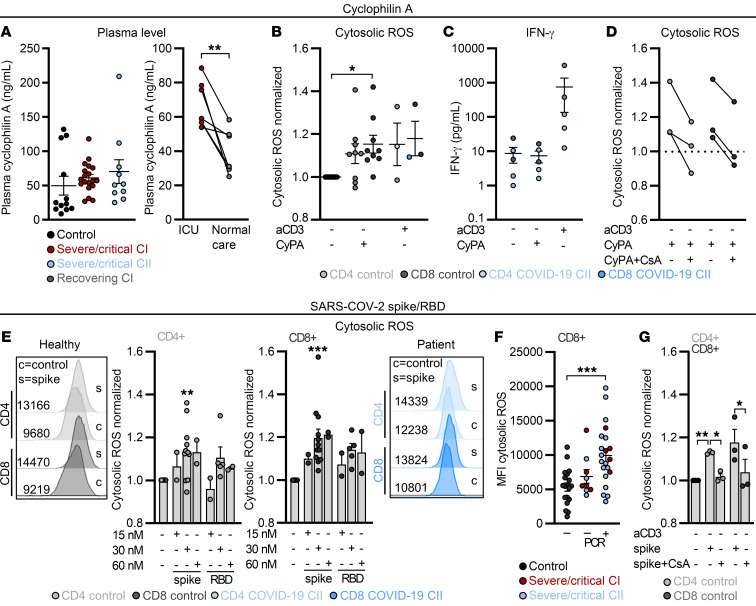
Figure 8. ROS can be triggered by cyclophilin A and SARS-CoV-2 spike protein and is mitigated by cyclosporine A in vitro.
(A) Cyclophilin A (CyPA) levels were determined in plasma of controls and severe/critical patients of cohort I and II and in paired patient samples taken at the intensive care unit (ICU) and after returning back to normal care unit. **P < 0.01 by Wilcoxon’s test. (B–G) Blood was drawn and processed the same day. PBMCs were treated for 24 hours as indicated. (B) The impact of CyPA on cytosolic ROS was determined. Data normalized to unstimulated cells of the respective donor are shown. (C) IFN-γ in culture supernatants was determined by ELISA. (D) The effect of CsA on CyPA-induced cytosolic ROS was determined. Data normalized to unstimulated T cells of the respective donor are shown. (E) Cytosolic ROS in CD4+ and CD8+ T cells in the presence of increasing concentrations of the SARS-CoV-2 spike protein (spike) or respective receptor binding domain (RBD). Data normalized to unstimulated T cells of the respective donor are displayed. Representative histograms for controls and 1 patient are displayed. (F) Cytosolic ROS levels in controls and severe/critical COVID-19 patients PCR negative or positive for SARS-CoV-2 are displayed. MFI, median fluorescence intensity. (G) Impact of CsA on spike-induced cytosolic ROS levels was determined in CD4+ and CD8+ T cells. Data normalized to unstimulated T cells of the respective donor are displayed. Each symbol represents 1 donor, and summarized data are displayed as mean ± SEM (A–C and F) or mean + SEM (E and G). *P < 0.05; **P < 0.01; ***P < 0.001 by 1-way ANOVA with Bonferroni’s multiple comparisons test (B, F, and G; T cell population–specific comparison in B and G) or Mann-Whitney U test (E).

