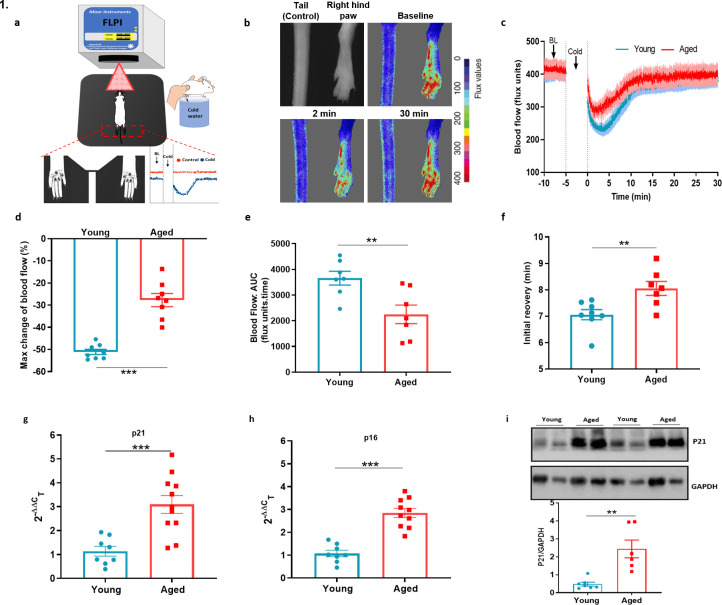
Figure 1. Cold-induced vascular response is impaired with ageing.
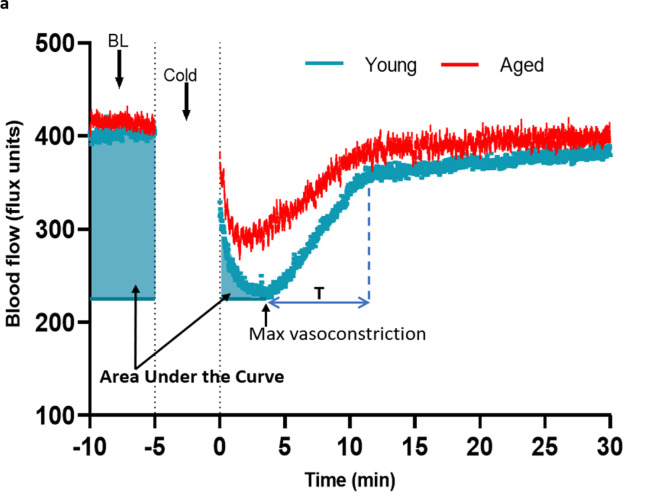
(a) Diagram illustrates the experimental setup of cold-induced vascular response protocol; FLPI from top measures the blood flow in the hindpaw of the anaesthetised mouse when on a heating mat in response to cold water immersion. The expanded component (highlighted by dotted red lines) shows the hindpaw region in which the blood flow is recorded, and a graph of typical blood flow response is shown. Recording is paused for cold treatment where one of the hindpaw is immersed in cold water for 5 min. (b) Representative FLPI image shows the blood flow in cold-treated hind paw at baseline, 2 min and 30 min after the cold water treatment. (c) Graph shows the raw blood flow trace (mean ± s.e.m.) of vascular response with cold (4 °C) water treatment (n = 8). (d) % change in hindpaw blood flow from baseline to 0–2 min following cold water treatment (maximum vasoconstriction). (e) The AUC to maximum vasoconstriction point assessed by area under the curve (AUC). (f) Time of blood flow recovery immediately after maximum vasoconstriction until the start of the plateau period. (g–h) RT-PCR CT analysis shows fold change of P21 and P16 gene expression normalised to three housekeeping genes in dorsal root ganglia (DRG) of young and aged mice. (i) Representative western blot of p21 in hindpaw skin of young and aged mice and densitometric analysis normalised to GAPDH. (BL = baseline). Data is presented as mean and all error bars indicate s.e.m. (n = 6–11) **p < 0.01, ***p < 0.001. (Two-tailed Student’s t-test).


