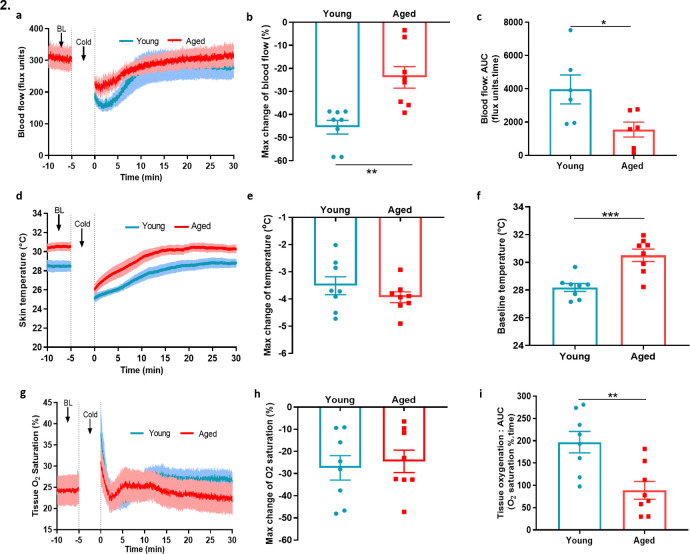
Figure 2. Blood flow, skin temperature and tissue oxygen saturation with cold treatment in ageing.
(a) The mean ± s.e.m. blood flow trace of the vascular response with cold (4 °C) water treatment (n = 8). (b) % change in hindpaw blood flow from baseline to 0–2 min following cold treatment (maximum vasoconstriction). (c) The vasoconstriction response caused by cold water treatment represented by area under curve (AUC). (d) The mean ± s.e.m. recordings of hindpaw skin temperature with cold water treatment. (e) Maximum reduction in skin temperature following 5 min cold treatment. (f) The baseline skin temperature. (g) % mean ± s.e.m. tissue oxygen saturation during cold water treatment. (h) % maximum change in tissue oxygen saturation from baseline following cold water treatment (i) % tissue oxygen saturation recovery after cold water treatment assessed by area under the curve. (BL = baseline). Data is presented as mean and all error bars indicate s.e.m. (n = 8) *p < 0.05, **p < 0.01, ***p < 0.001. (Two-tailed Student’s t-test).


