. 2021 Oct 26;10:e72353. doi: 10.7554/eLife.72353

Figure 1. SMG1i specifically inhibits SMG1 kinase activity in vitro.

(A) Structure of the SMG1 inhibitor (SMG1i). (B) Titration of SMG1i using a mass spectrometry-based phosphorylation assay with 500 nM SMG1-8-9 and the indicated UPF1-derived peptides as substrates. (C) Titration of SMG1i using a radioactivity-based phosphorylation assay with 100 nM SMG1-8-9 and full-length UPF1 as a substrate. The Coomassie-stained gel is shown on top, and the corresponding radioactive signal is below. (D, E) Titration of SMG1i using a radioactivity-based phosphorylation assay with either SMG1-8-9 and full-length UPF1 (D) or mTORΔN-LST8 and GST-AKT1 (E) as a substrate. Stain-free gels are shown on top and the corresponding radioactive signal at the bottom (Ladner et al., 2004). (F) Quantification of normalized UPF1 or mTOR (auto-)phosphorylation in the presence of increasing amounts of SMG1i for both SMG1 and mTOR. For each data point, the mean is shown with standard deviations of the three replicates indicated.

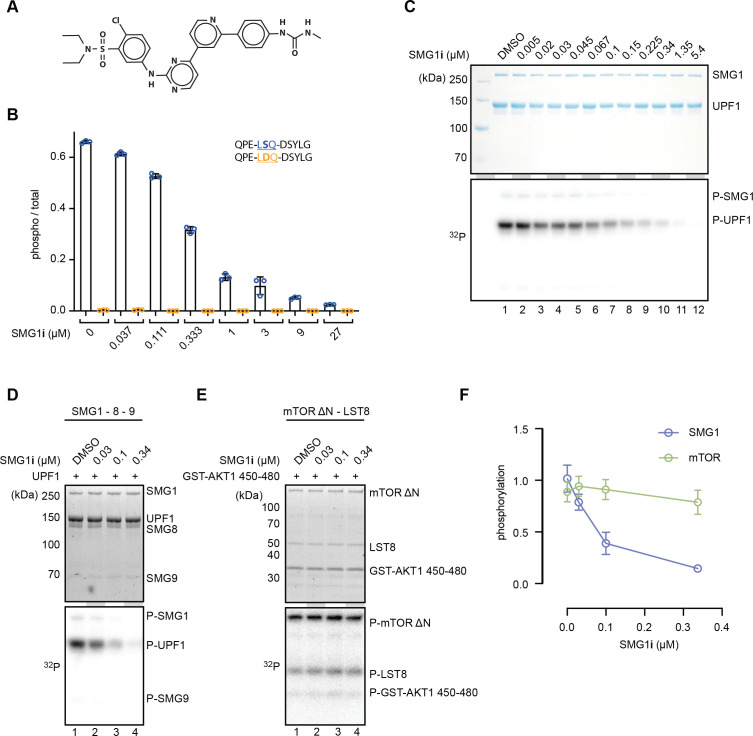
Figure 1—source data 1. Unedited images for gels shown in Figure 1.

Figure 1.

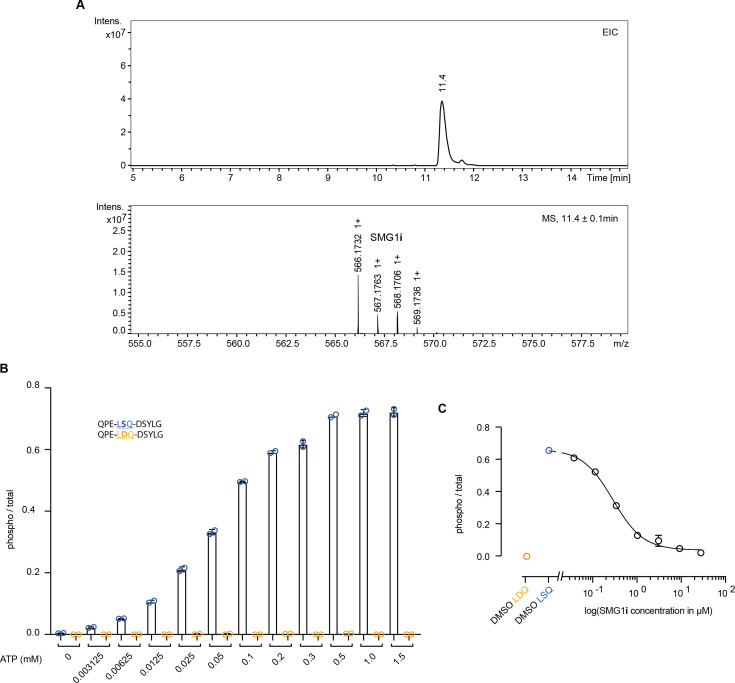
Figure 1—figure supplement 1. Characterization of SMG1 inhibitor.

Figure 1—figure supplement 1.

(A) Liquid chromatography-mass spectrometry (LC-MS) experiment with the SMG1 inhibitor sample used throughout this study. The expected mass for SMG1i is 566.13 Da. Differences of +1 are caused by the varying composition of naturally occurring carbon isotopes. (B) Titration of ATP requirement in mass spectrometry-based phosphorylation assay using 500 nM SMG1-8-9 and the indicated UPF1-derived peptides as substrates. 0.75 mM ATP was chosen for later experiments. (C) Dose-response curve for SMG1i in mass spectrometry-based phosphorylation assay (using triplicate data points shown in Figure 1B). Phosphorylation ratios of substrate (blue) and control peptide (orange) in the absence of SMG1i are shown as mean values with error bars indicating standard deviation (were large enough to visualize). The control peptide was included for reference but was not used for fitting.
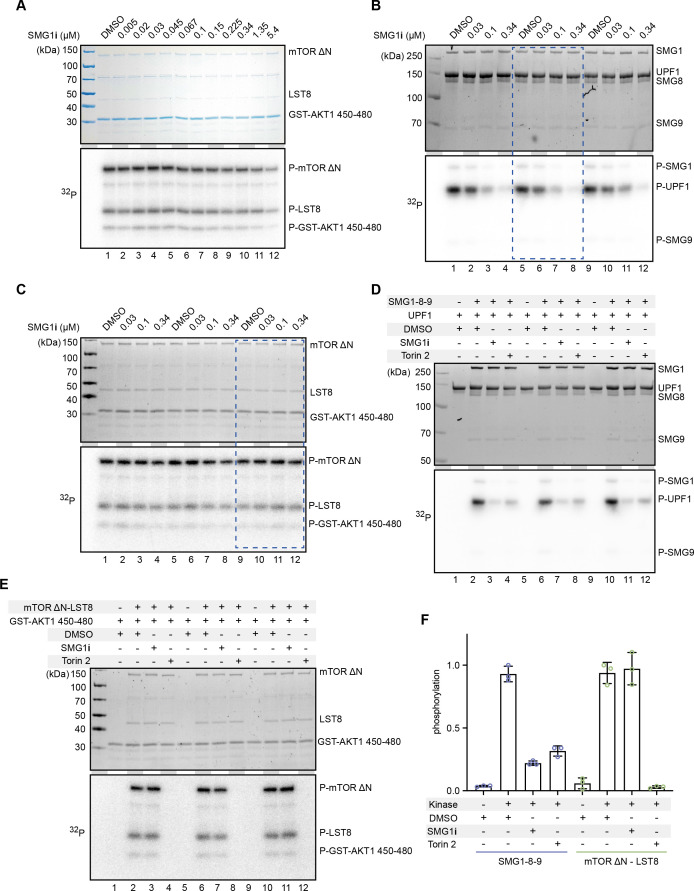
Figure 1—figure supplement 2. Radioactivity-based phosphorylation assays using SMG1 inhibitor with SMG1 and mTOR.

Figure 1—figure supplement 2.

(A) Titration of SMG1i using 100 nM mTOR-LST8 and GST-AKT1 as a substrate. The Coomassie-stained gel is shown on top and the radioactive signal on the bottom. (B, C) SMG1-8-9 or mTOR-LST8 kinase assay with four selected concentrations of SMG1i. Assays were performed in triplicates and used for quantification. The blue rectangle indicates the replicate of the assays shown in Figure 1. (D, E) SMG1-8-9 or mTOR-LST8 kinase assay supplemented with either DMSO, SMG1i, or Torin 2. A control without kinase was included. The highest concentration of SMG1i (0.34 µM) was used in panels (B, C) and the same amount of Torin 2 was used. Both assays were performed in triplicates. (F) Quantification of normalized UPF1 or mTOR (auto-)phosphorylation of the experimental triplicates shown in panels (D, E).
Figure 1—figure supplement 2—source data 1. Unedited images for gels shown in Figure 1—figure supplement 2.