. 2021 Oct 26;10:e72353. doi: 10.7554/eLife.72353

Figure 3. Structures of SMG1-8-9 and SMG1-9 complexes reveal that the SMG1 insertion domain can block the substrate-binding path in the presence of SMG8.

(A) Cryo-EM density of SMG1-8-9 bound to SMG1i. Density for the inhibitor is in magenta, the N-terminus of the SMG1 insertion is in red, and all other parts as indicated. (B) Cryo-EM density of SMG1-9 complex bound to the SMG1 inhibitor. Everything else as in (A). (C) Cryo-EM density of SMG1-8-9 bound to AMPPNP. Density for AMPPNP is in orange and extra density attributed to the SMG1 insertion is in red. (D) As in (C), but for the SMG1-9 complex bound to AMPPNP. Insets I–IV show close-ups of the indicated kinase active site densities superimposed with the model for the UPF1-LSQ substrate shown as blue sticks (PDB identifier: 6Z3R). All maps segmented. cryo-EM, cryo-electron microscopy.

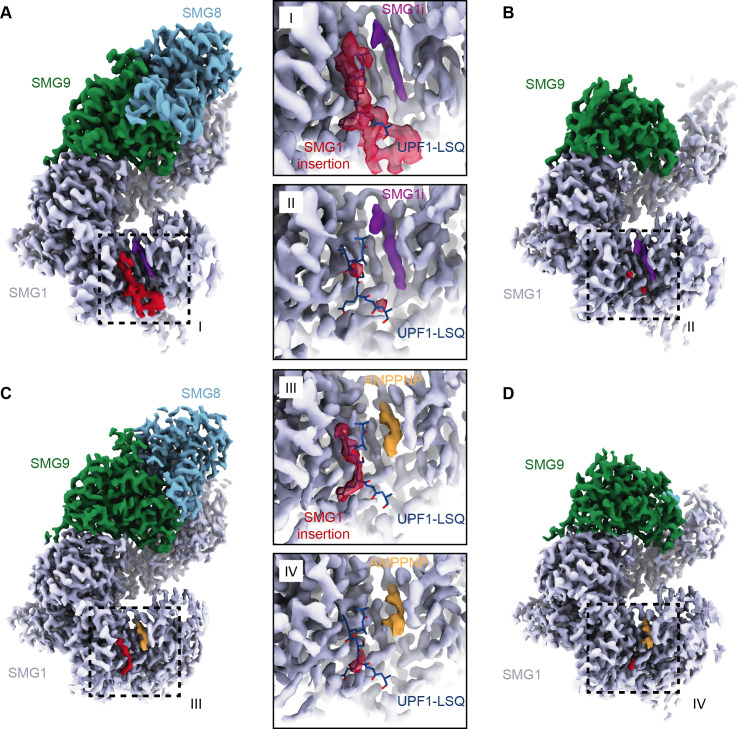
Figure 3.

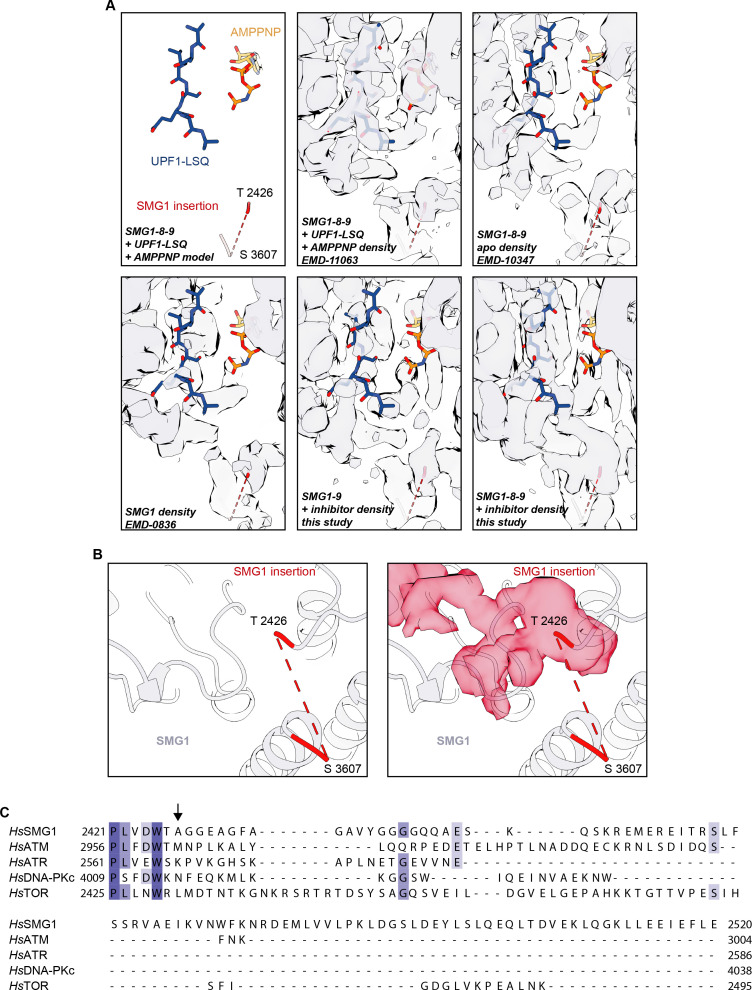
Figure 3—figure supplement 1. Details of the SMG1 insertion N-terminus.

Figure 3—figure supplement 1.

(A) Model of SMG1 active site bound to UPF1-LSQ substrate and AMPPNP (PDB identifier: 6Z3R) shown superimposed with the corresponding EM density (EMD-11063) and the densities for apo SMG1-8-9 (EMD-10347), SMG1 (EMD-0836), SMG1i-bound SMG1-9, and SMG1i-bound SMG1-8-9. Note that the UPF1-LSQ model is partially covered by density protruding from the SMG1 insertion domain residue Thr2426 only in the inhibitor-bound SMG1-8-9 complex. (B) The isolated extra density (shown in red) observed in the active site of the SMG1i-bound SMG1-8-9 complex connects to the modeled N-terminus of the SMG1 insertion domain. The left panel highlights the last modeled N- and C-terminal residues of the insertion domain. The right panel shows the same view, superimposed with the isolated extra density. (C) Multiple sequence alignment of the N-terminal 100 residues of the SMG1 insertion domain and the PRDs of the other human PIKK family members colored by identity. The beginning of the unmodeled part of the SMG1 insertion is indicated by a black arrow (compare B). EM, electron microscopy.
Figure 3—figure supplement 2. Resolution distribution and isotropy of SMG1-centered cryo-EM maps bound to AMPPNP.

Figure 3—figure supplement 2.

AMPPNP-bound reconstructions used in this study for model building are colored according to estimated local resolution shown in two different orientations. A three-dimensional FSC plot is included for each reconstruction (Tan et al., 2017). The red line represents the estimated global masked half map FSC. The resolutions according to the gold standard FSC cutoff of 0.143 are indicated and shown as a black dashed line (Rosenthal and Henderson, 2003). The spread of directional resolution values is defined as ±1σ (dashed gray lines). Overall isotropy of the maps is indicated by the given sphericity values (out of 1). In the bottom row of each panel, a model versus map FSC is shown alongside a plot visualizing the distribution of particle views. (A) SMG1-8-9 bound to AMPPNP (EMD-13678, PDB identifier: 7PW8). (B) SMG1-9 bound to AMPPNP (EMD-13679, PDB identifier: 7PW9). cryo-EM, cryo-electron microscopy; FSC, XXX.
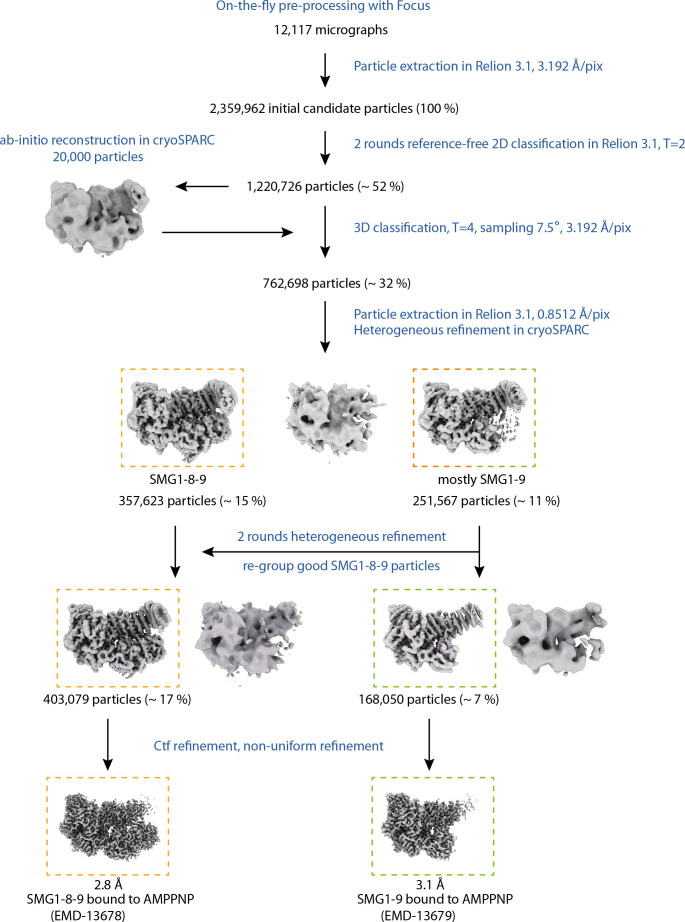
Figure 3—figure supplement 3. Cryo-EM data processing of AMPPNP data set.

Figure 3—figure supplement 3.

Processing steps are indicated in blue; particle numbers and percentages with respect to initial candidate particles are shown for relevant classes. Colored, dashed rectangles indicate the different final reconstructions and the respective classes obtained from the data set collected in the presence of AMPPNP. cryo-EM, cryo-electron microscopy.
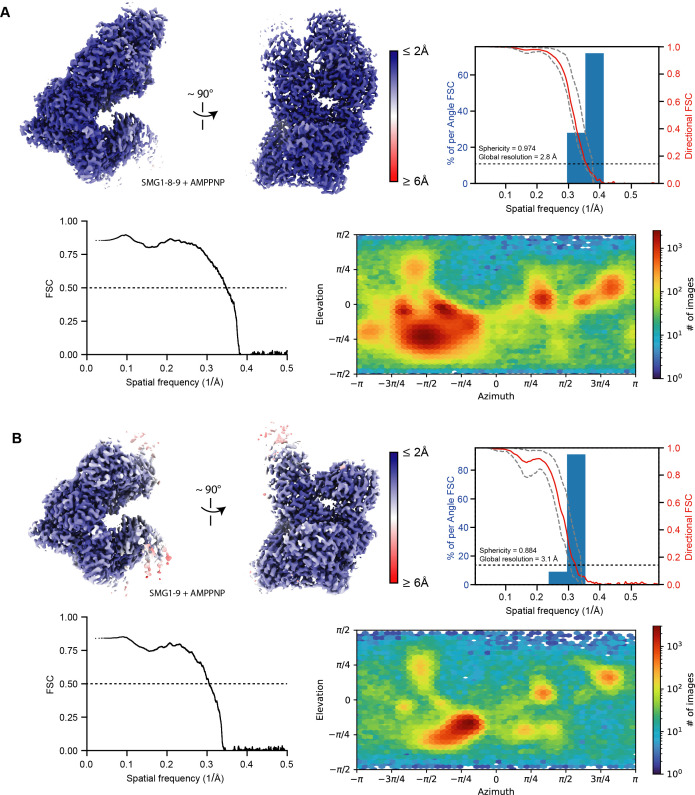
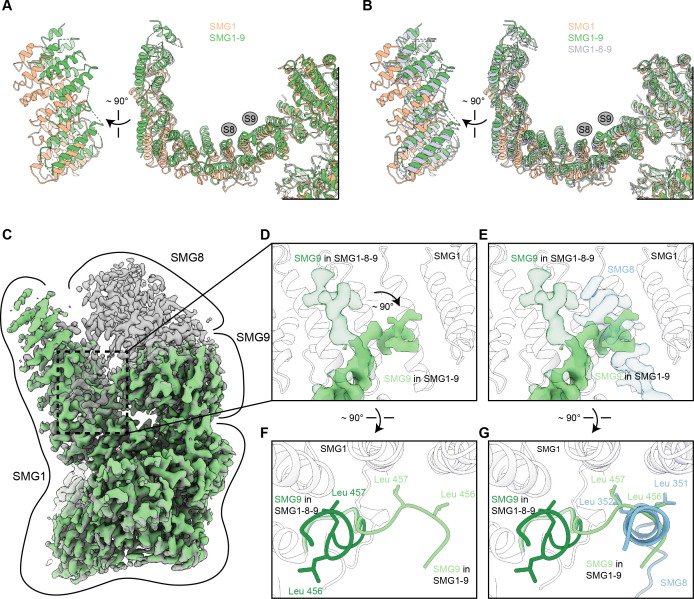
Figure 3—figure supplement 4. Details of the SMG1-9 complex.

Figure 3—figure supplement 4.

(A) Overlay of SMG1 (PDB identifier: 6L53) and SMG1-9 detailing movements of the N-terminal HEAT repeats. A front and a side view are shown and binding sites for SMG8 and SMG9 are indicated by gray circles. (B) As in (A), but including SMG1-8-9 (PDB identifier: 6Z3R). Models of SMG8 and SMG9 were occluded. (C) Overlay of densities for SMG1-9 and SMG1-8-9 complexes, with SMG1-9 density in light green and SMG1-8-9 density in transparent gray. Approximate location of the single proteins within the densities are indicated. (D) Close-up showing the rearrangement of an SMG9 segment in the SMG1-9 complex compared to the SMG1-8-9 complex. Density of the segment in SMG1-9 is shown in light green, superimposed with the SMG9 segment in SMG1-8-9 displayed in transparent dark green. The model for the interacting region of the SMG1 arch is shown as a transparent cartoon, and SMG8 is not shown. (E) same as (D), but with density for an SMG1-interacting SMG8 segment in the SMG1-8-9 complex shown in transparent blue, that would clash with the SMG9 segment conformation observed in the SMG1-9 complex. (F) Overlay of the model of the SMG9 segment in the SMG1-9 (light green) and the SMG1-8-9 (dark green) complex. Two Leu residues undergoing rearrangement between the two complexes are shown. Position of SMG1 is indicated, SMG8 is not shown. (G) same as in (F), but shown with the SMG1-interacting SMG8 segment (blue). In the SMG1-9 complex, the highlighted pair of Leu residues in SMG9 substitutes for a pair of SMG8 Leu residues on the SMG1 arch.