. 2021 Oct 26;10:e72353. doi: 10.7554/eLife.72353

Figure 4. The SMG1 insertion domain can block overall access to the kinase active site.

(A) Cryo-EM map after 3D variability analysis filtered by resolution and segmented. Two different views displaying extra density for SMG8 C-terminus (dark blue) and SMG1 insertion domain. The location of the SMG1 kinase active site is indicated by an orange circle. (B) Inter and intra cross-links of the SMG1-8-9 kinase complex. Proteins are colored as in (A). Intra-links shown in Figure 4—figure supplement 1B, C are in black, the inter-link shown in Figure 4—figure supplement 1D is in blue, and inter-links between SMG1 insertion and SMG1 C-terminus are in red. (C) Zoom-in highlighting positions of Lys residues (magenta spheres) crosslinking to the C-terminus of the SMG1 insertion domain. A table listing the cross-linked residues is shown below. Cross-links found in only one of two samples are in italics. (D) Coomassie-stained SDS-PAGE analysis of pull-down experiment showing an interaction between SMG1 insertion domain (SMG12427–3606) and SMG8 C-terminus (SMG8728–991). cryo-EM, cryo-electron microscopy.

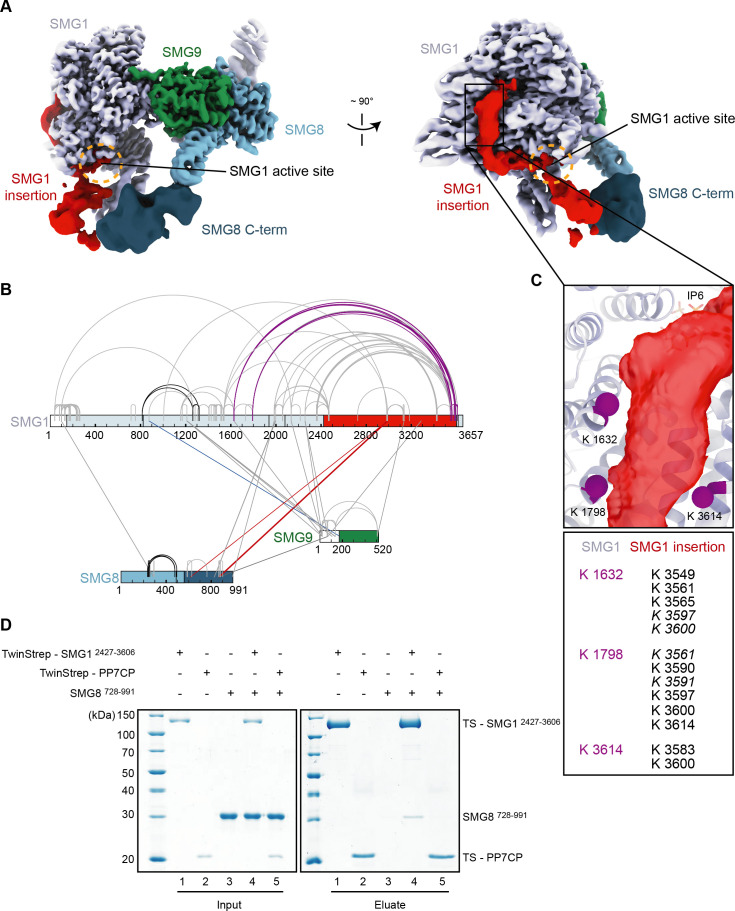
Figure 4—source data 1. Table with cross-linking data used in Figure 4.
Figure 4—source data 2. Unedited images for gels shown in Figure 4.

Figure 4.

Figure 4—figure supplement 1. Cross-linking mass spectrometry of SMG1-8-9.

Figure 4—figure supplement 1.

(A) Two samples of SMG1-8-9 (lanes 1 and 2) were incubated with BS3 (lanes 3 and 4) and analyzed using SDS-PAGE and Coomassie staining. (B) Exemplary intra cross-links detected for SMG1 mapped on the model of the apo complex (PDB identifier: 6SYT). Intra cross-links are shown in black with the thickness of the line indicating their score (thicker=higher score), and the respective residues indicated as spheres. A cross-link to an unmodeled region is shown in white (placed in the middle of the segment whose ends are the closest visible Cα atoms). (C) Same as (B), but for SMG8. (D) Inter cross-link between SMG1 and SMG9. The Mg2+-ion complexed with SMG9 was omitted. (E) Table listing measured distances for cross-links visualized in panels (B–D).
Figure 4—figure supplement 1—source data 1. Unedited images for gels shown in Figure 4—figure supplement 1.
Figure 4—figure supplement 2. Selected spectra of detected SMG1-8-9 intra-links.

Figure 4—figure supplement 2.

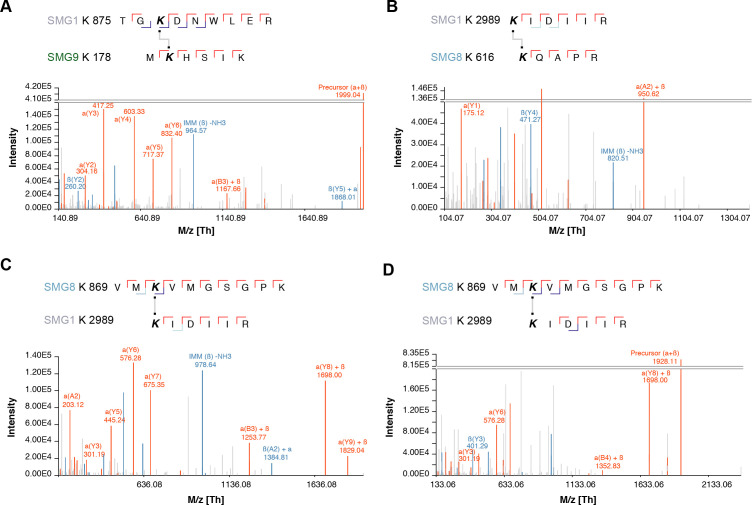
(A–D) Cross-links are shown above each panel. All spectra showed good sequence coverage with full y-ion series, many b-ions, and highly specific fragments.
Figure 4—figure supplement 3. Integration of cryo-EM, cross-linking MS, and AlphaFold data reveals a model for the SMG8 C-terminus.

Figure 4—figure supplement 3.

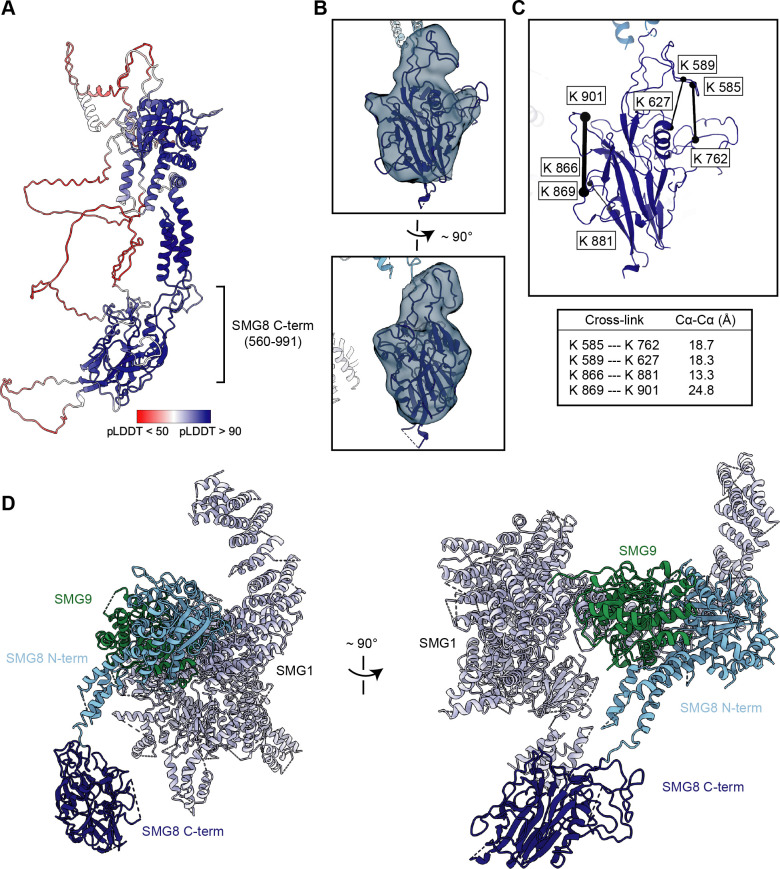
(A) AlphaFold model of full-length SMG8 (UniProt: Q8ND04) colored by per-residue confidence score (pLDDT) (Jumper et al., 2021). The previously unmodeled SMG8 C-terminus is indicated. (B) AlphaFold model of the SMG8 C-terminus (dark blue) rigid-body fitted into the isolated cryo-EM density and fused to the modeled N-terminal part of SMG8 (light blue), shown in two related views. Regions with a pLDDT<50 were deleted from the model. (C) Intra cross-links of the SMG8 C-terminus mapped on the model, as described in Figure 4—figure supplement 1. A table shows the corresponding measured distances. (D) New model of the SMG1-8-9 complex, now including the SMG8 C-terminal region, shown from two different perspectives (PDB identifier: 7PW5). cryo-EM, cryo-electron microscopy.
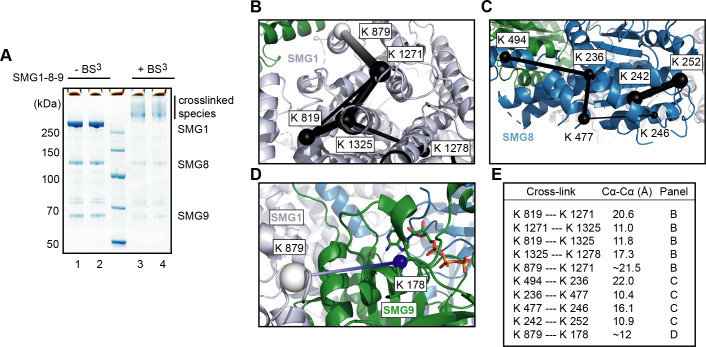
Figure 4—figure supplement 4. Further characterization of SMG1-8-9—centered interactions.

Figure 4—figure supplement 4.

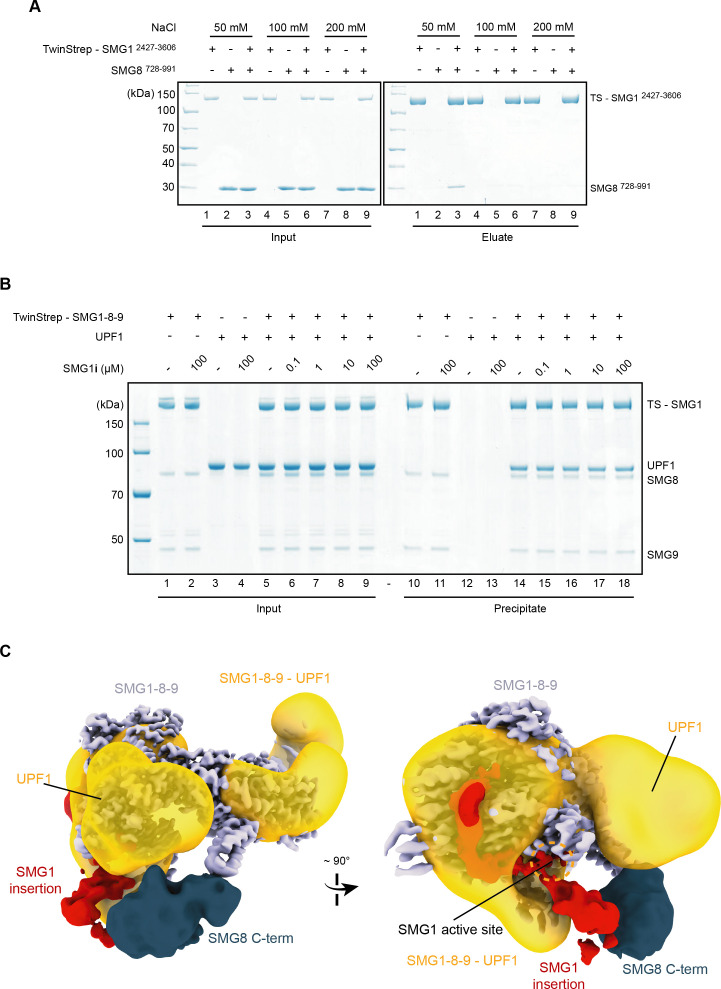
(A) Coomassie-stained SDS-PAGE analysis of pull-down experiment showing that the interaction between SMG1 insertion domain (SMG12427–3606) and SMG8 C-terminus (SMG8728–991) is dependent on low-salt conditions. (B) Coomassie-stained SDS-PAGE analysis of pull-down experiment showing that SMG1-8-9—SMG1i complex formation does not prevent interaction with UPF1. 0.12 μM of TS-SMG-1-8-9 and 0.4 μM of UPF1 were used throughout. (C) The resolution-filtered, segmented cryo-EM density of SMG1i-bound autoinhibited SMG1-8-9 complex fitted in a negative-stain reconstruction of a cross-linked SMG1-8-9—UPF1 complex (EMD-2664) shown in orientations similar to Figure 4A. The density within the negative-stain reconstruction assigned to UPF1 is indicated.
Figure 4—figure supplement 4—source data 1. Unedited images for gels shown in Figure 4—figure supplement 4.