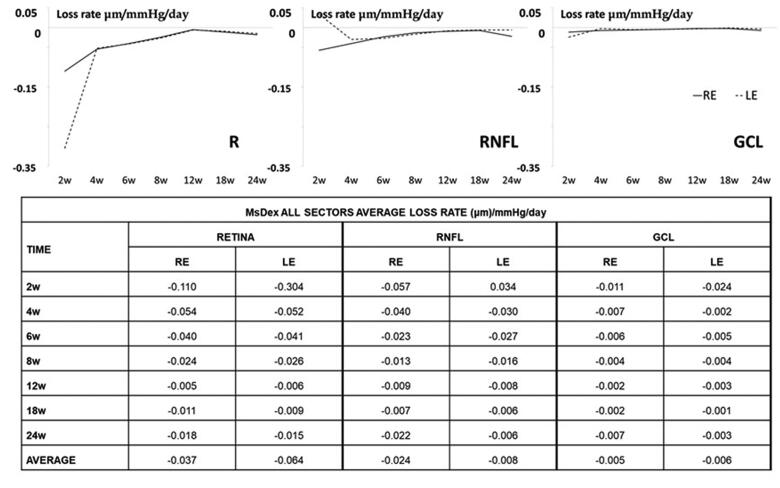
Figure 7.
Neuroretinal loss rate, measured by optical coherence tomography (OCT), in the dexamethasone-loaded microsphere (MsDex) model. MsDex: microspheres loaded with dexamethasone; RE: right eye; LE: left eye; w: week; RNFL: retina nerve fiber layer; GCL: ganglion cell layer. Each data is obtained from baseline time.

