
Figure 1.
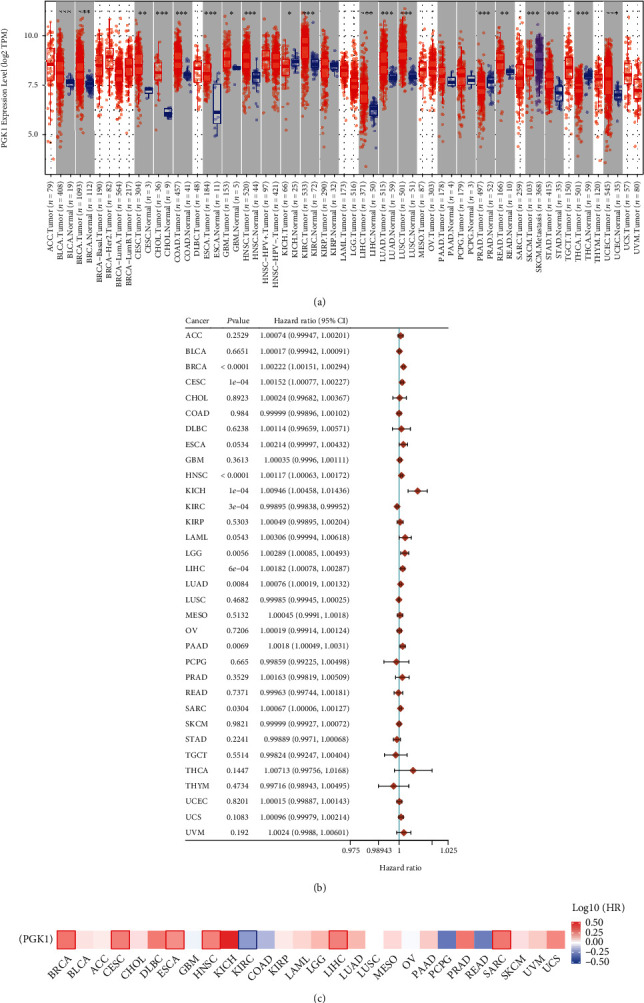
Expression and prognostic impacts of PGK1 across pan-cancer. (a) Abnormal expression of PGK1 mRNA between control and cancer tissue specimens based on the TIMER2.0 web server. The red, blue, and purple bubbles separately meant tumor, normal, and metastatic specimens. ∗p < 0.05; ∗∗p < 0.01; ∗∗∗p < 0.001. (b) Univariate-cox regression analysis for evaluating the correlation between PGK1 mRNA expression and survival outcomes of cancer patients. Forest plots showed the hazard ratio (HR), 95% confidence interval (CI), and p of PGK1 in 33 cancer types. (c) Prognostic impacts of PGK1 mRNA expression across pan-cancer utilizing the Survival Map module of the GEPIA2 web server. The heat map showed the HRs in logarithmic scale (log10) of PGK1. The red and blue blocks separately denoted increased and reduced risks. The rectangle with frame meant the significantly undesirable and desirable clinical outcomes according to prognostic analysis.