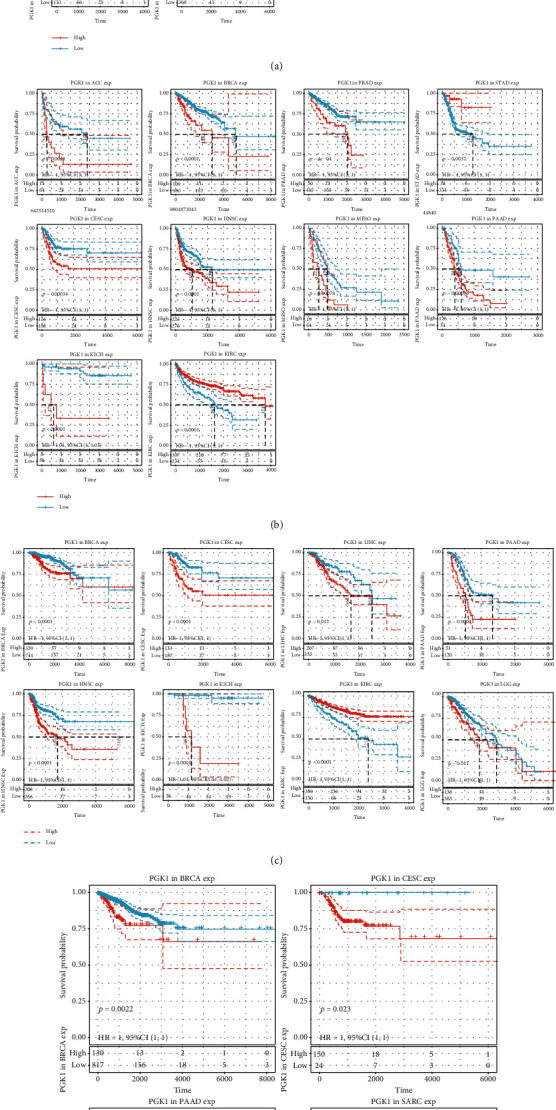
Figure 2.

Impact of PGK1 expression on overall survival (OS), progression-free interval (PFI), disease-specific survival (DSS), and disease-free interval (DFI) across pan-cancer. (a) Kaplan-Meier curve depicting the marked difference in OS between up- and downregulated PGK1 samples in diverse cancer types. (b) Kaplan-Meier curve demonstrating the marked difference in PFI between up- and downregulated PGK1 samples in different cancer types. (c) Kaplan-Meier curve depicting the marked difference in DSS between up- and downregulated PGK1 samples in diverse cancer types. (d) Kaplan-Meier curve depicting the marked difference in DFI between up- and downregulated PGK1 samples in diverse cancer types. p value was determined with log-rank test.
