
Figure 1.
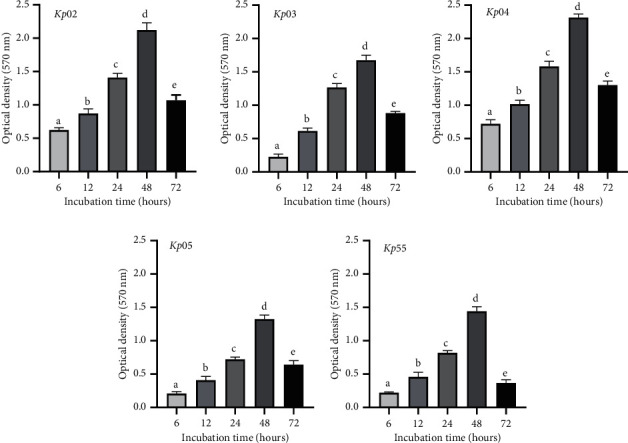
Kinetics of the biofilm-producing capacity of K. pneumoniae clinical isolates. Clinical isolates of K. pneumoniae were incubated for 72 h, and the biofilm was analyzed at 6, 12, 24, 48, and 72 h to determine the best time for maximum biofilm formation. The bar graphs represent the mean (n = 3) ± standard deviation (error bars) of the values corresponding to each time of incubation for biofilm formation. Different letters (a, b, c d, and e) above bars indicate a significant difference between the values (p < 0.05 according to Fisher's least significant difference).