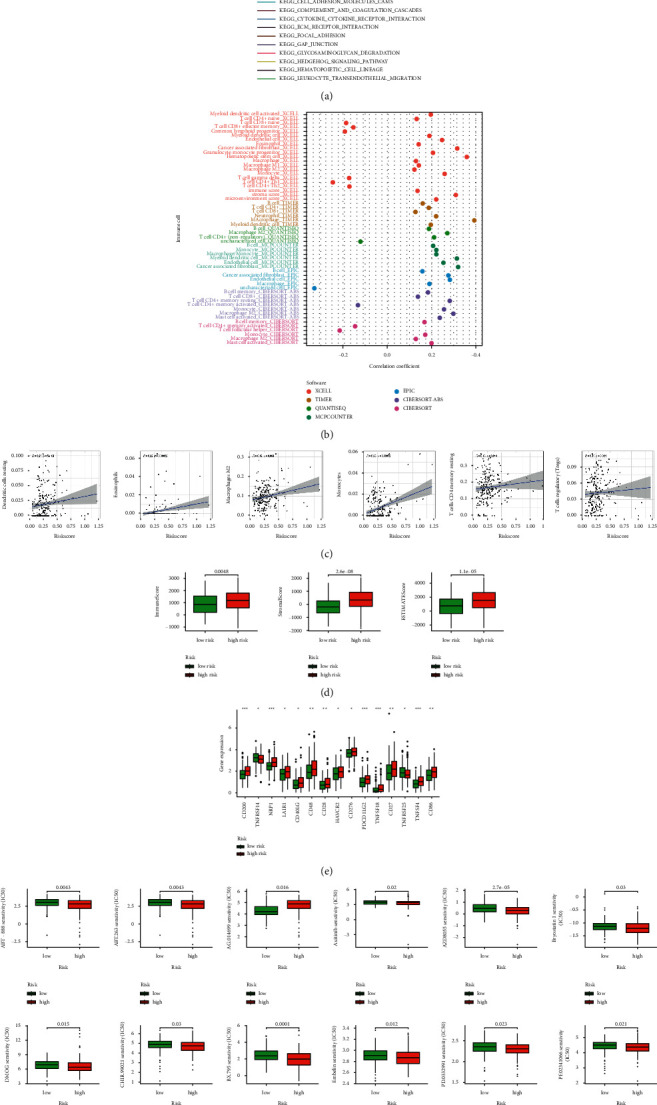
Figure 6.

The investigation of tumor immune factors and immunotherapy. (a) GSEA of the top 10 pathways significantly enriched in the high-risk group. (b) The immune cell bubble of risk groups. (c) The correlation between risk score and immune cells. (d) The comparison of immune-related scores between low- and high-risk groups. (e) The difference of 15 checkpoints expression in risk groups. (f) The immunotherapy prediction of risk groups.
