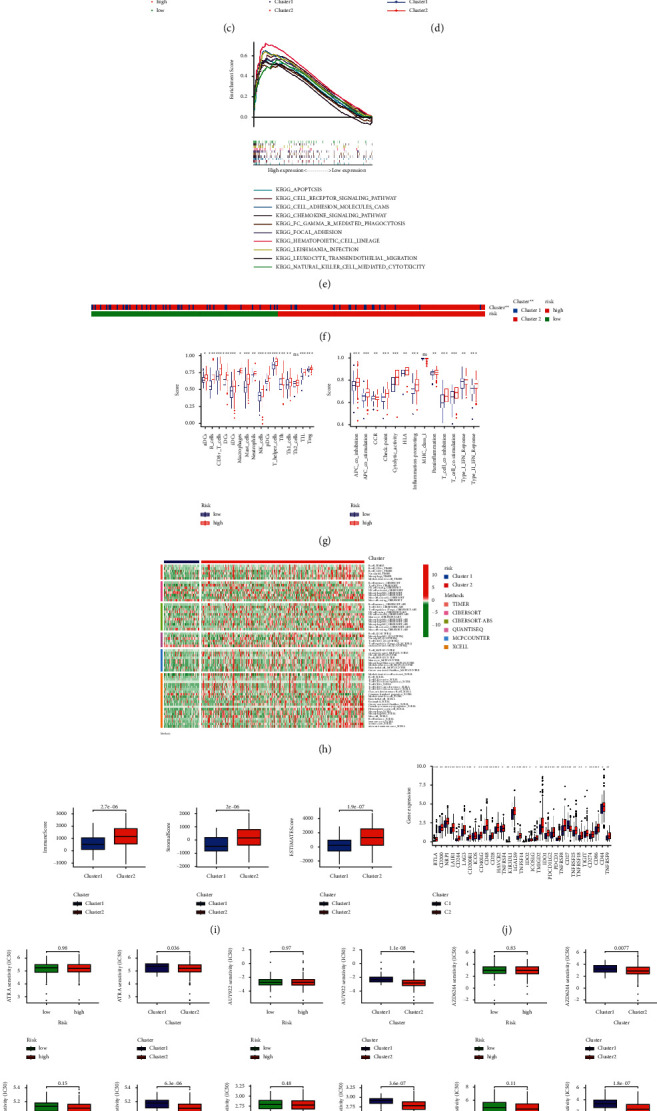
Figure 7.

Distinction between cold and hot tumors and immunotherapy prediction. (a) Patients divided into two clusters by ConsensusClusterPlus. (b) The t-SNE of two clusters. (c) The PCA of risk groups and clusters. (d) Kaplan–Meier survival curves of OS in clusters. (e) GSEA of cluster 2. (f) The relationship between risk groups and clusters. (g) The ssGSEA scores of immune cells and immune functions in clusters. (h) The heat map of immune cells in clusters. (i) The comparison of immune-related scores between clusters 1 and 2. (j) The difference of 32 checkpoints expression in clusters. (k) Nine immunotherapeutic drugs solely showing significant IC50 difference.
