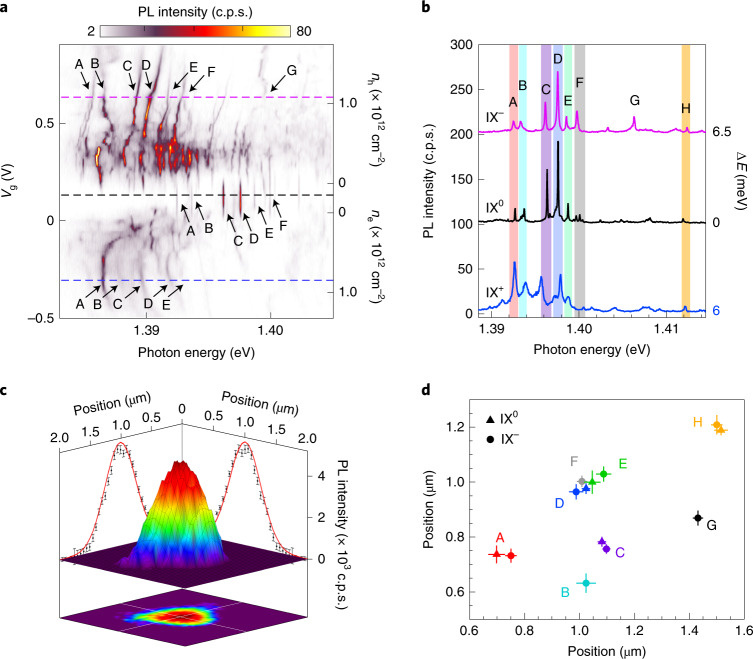
Fig. 2. Doping dependence of moiré IXs.
a, PL spectrum map as a function of Vg. The prominent IX emission peaks are labelled as A–G in each doping region. The dashed lines identify the Vg of the linecuts for the spectra shown in b. ne, electron density; nh, hole density. b, Representative PL spectra for trapped IX0, IX– and IX+. For direct comparison with the IX0 PL spectrum, the IX– (IX+) PL spectra are shifted by 6.5 (6.0) meV in relative photon energy. c, A high-resolution spatial map of the integrated PL intensity of emitter D. From the Gaussian fits, the spatial position can be determined with ~25 nm precision. d, Spatial positions of the trapped IX0 and IX– for various emitters. Error bars represent the standard deviation of repetitive measurements.

