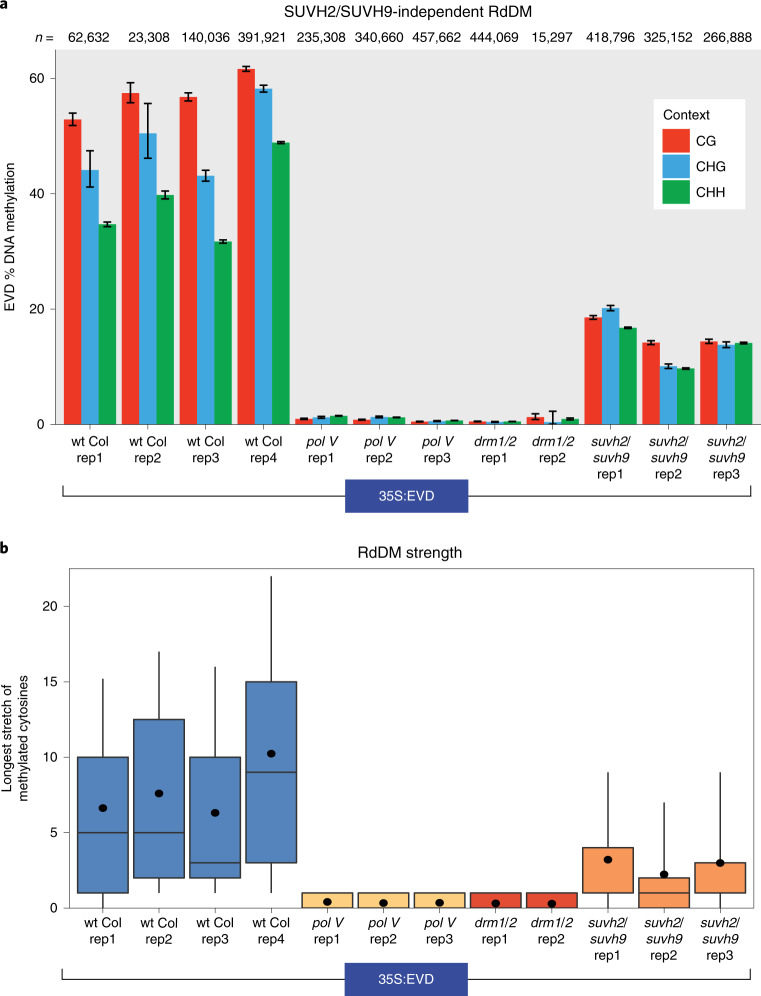
Fig. 1. SUVH2/SUVH9-independent function of Pol V.
a, BSAS of the 35S:EVD transgene in independent biological replicates of T1 plants. The bar displays the methylation percentage and the error bars represent the 95% confidence interval calculated using the Wilson score interval method. n is the number of total cytosines assayed for each amplicon. H is A, C or T. b, RdDM strength plot of DNA methylation. RdDM strength was measured by calculating the length of stretches of consecutively methylated cytosines along individual sequence reads. All box plots in this paper represent 25th and 75th percentile values with whiskers at the 10th and 90th percentiles, the median is represented by a line and the mean is denoted by a filled circle.

