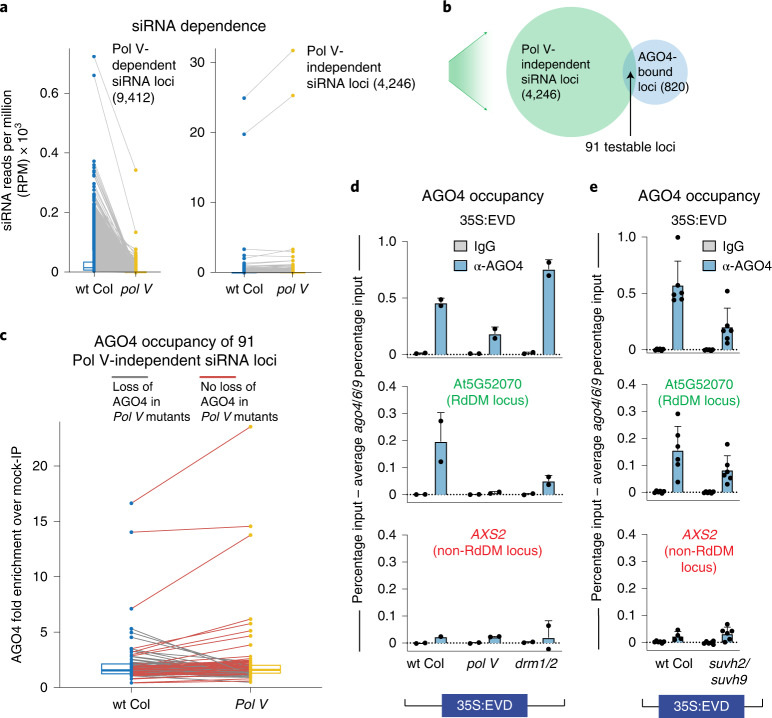
Fig. 4. AGO4 can localize to chromatin loci independent of Pol V.
a, Box plot with connected data points of 23–24-nt siRNA accumulation in wt Col (blue) and pol V mutants (yellow). The siRNA loci are defined as Pol V-dependent or -independent on the basis of the change in siRNA accumulation in pol V compared to wt Col. Box plot percentiles are the same as in Fig. 3c. b, Venn diagram showing the overlap of Pol V-independent siRNA loci from a and AGO4-enriched loci as previously defined27. The overlap provides 91 testable loci for c. c, Box plot with connected data points of AGO4 protein enrichment. AGO4 occupancy is displayed as fold enrichment over mock-IP. Grey lines display loci that lose AGO4 occupancy in pol V mutants (31%). Red lines display loci that retain AGO4 occupancy in the pol V mutant background (69%). Box plot display is the same as in Fig. 3c. d, AGO4 ChIP of 35S:EVD T1 plants as percentage input minus the background of percentage input in T1 ago4/6/9 mutants. Bar graph display is the same as in Fig. 3b. At5G52070 is a positive control locus that undergoes RdDM, and AXS2 is a negative control gene that does not go through RdDM. Error bars represent the standard deviation of the mean of two biological replicates. This experiment was performed twice with similar results each time. e, AGO4 ChIP of 35S:EVD T1 plants as percentage input minus the background of percentage input in T1 ago4/6/9 mutant plants. Bar graph display is the same as in Fig. 4d. Error bars represent the standard deviation of the mean of six biological replicates.

