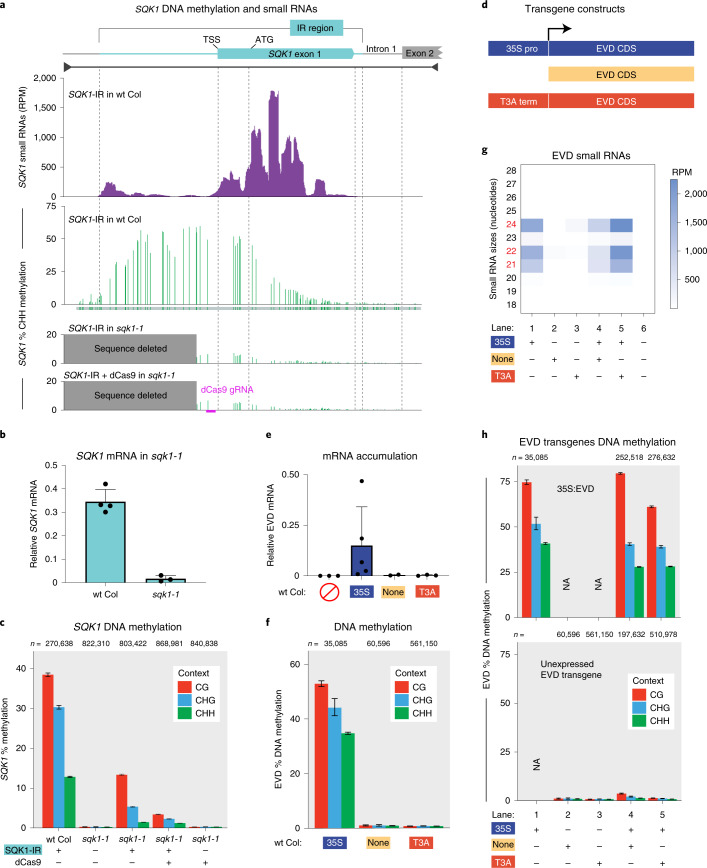
Fig. 6. The role of Pol II in the first round of RdDM.
a, CHH context DNA methylation and siRNAs (combined 21, 22 and 24 nt) aligned to the endogenous SQK1 gene. The region of SQK1 that matches the SQK1-IR transgene is annotated. The track below the SQK1-IR of wt Col CHH methylation identifies where each CHH context cytosine is located (green), even if unmethylated. The DNA methylation track for SQK1-IR in wt Col is produced from BSAS of two overlapping amplicons. Dashed lines align key annotation features of the SQK1 gene, and the location of the CRISPR gRNA used in the dCas9 experiment is annotated. b, RT–qPCR of plants homozygous for the SQK1 promoter deletion allele sqk1-1. The error bar represents the standard deviation of the mean in three biological replicates. c, BSAS of plants with and without the SQK1-IR, the homozygous sqk1-1 deletion and dCas9. The data display is the same as Fig. 1a. The wt Col sample is the same as replicate 2 in Fig. 5c. d, Depiction of three EVD TE transgenes. These transgenes share the exact coding sequence of EVD5 (AT5TE20395) lacking any vector-encoded terminator sequence while differing in their upstream elements. These upstream elements include the 35S constitutive promoter (from Fig. 1), no promoter and the T3A terminator. e, RT–qPCR of EVD mRNA in T1 transgenic plants indicates that only 35S:EVD has Pol II expression. The error bar represents the standard deviation of the mean of three biological replicates. f, BSAS of T1 transformants for each respective EVD transgene in wt Col. The data display is the same as Fig. 1a. The 35S:EVD sample is the same as replicate 1 from Fig. 1a. g, Heatmap of small RNA sequencing from single and double EVD transgenic plants. The siRNAs shown were mapped to the entire length of the EVD coding region, not just the region analysed by BSAS in f. The non-transgenic wt Col sample is the same as from Fig. 2a, whereas the 35S:EVD wt Col sample (lane 1) is from the T3 generation, to match the same 35S:EVD generation as in the double-transgenic plants (lanes 4 and 5). h, BSAS for the 35S:EVD transgene (top) and the second unexpressed EVD transgene (bottom) in the same transgenic individuals. NA, not applicable, as that transgene is not in this plant line. Biological replicates are shown in Supplementary Fig. 8. The data display is the same as Fig. 1a. The wt Col 35S:EVD sample (lane 1) is from the T3 generation, to match the same 35S:EVD generation as in the double-transgenic plants (lanes 4 and 5).

