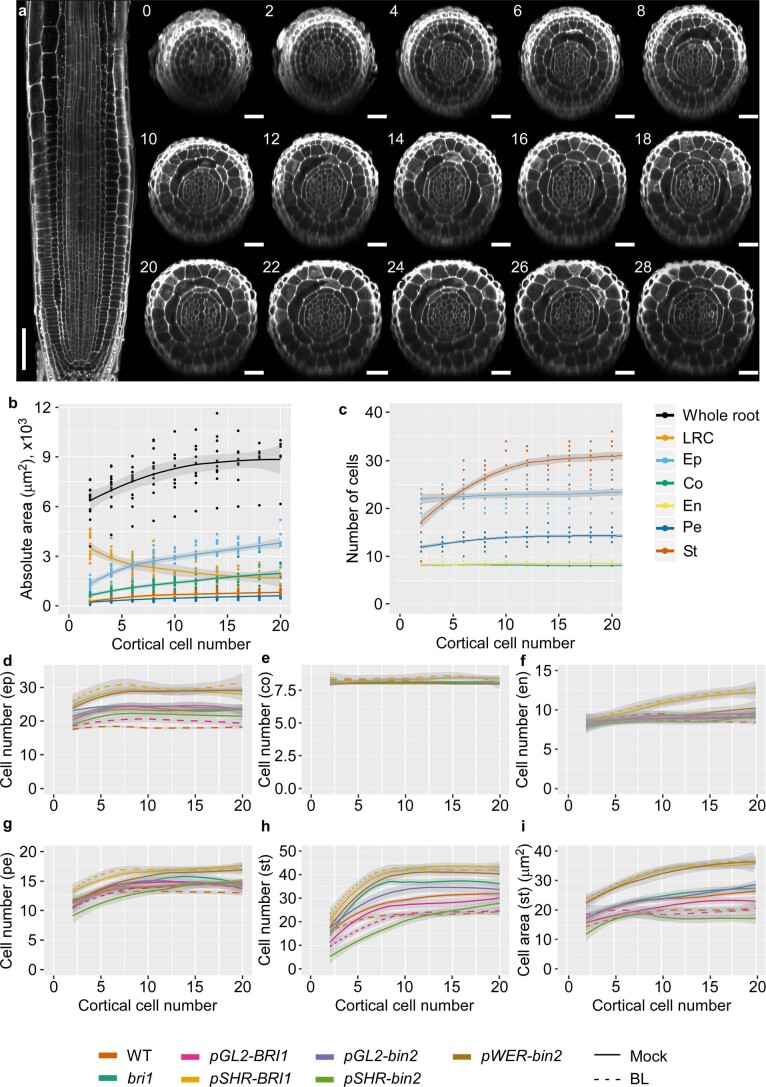
Extended Data Fig. 5. Quantification of growth parameters in the radial axis and their modulation by BR signaling.
a, Confocal images of a WT root and corresponding sequential radial section taken at the QC, marked by the position of the cortical cell (2 closest to the QC). Longitudinal scale bar = 50 μm, radial scale bar = 20 μm. b, Radial WT root area, as measured from radial cross-sections of the different tissues composing the root at a given distance from the QC, marked by position of cortical cells. n = 24 roots. c, Number of cells in radial cross-sections of the different tissues composing the WT root, at a given distance from the QC, marked by position of cortical cells. n = 24 roots. d-h, Number of cells in radial cross-sections of the different tissues composing the root, at a given distance from the QC, marked by position of cortical cells in lines and number of individual roots, as in Fig. 4b. i, Average area of stele cells of lines as in d-h. Shades are standard error bounds as calculated by loess. LRC, lateral root cap; ep, epidermis; co, cortex; en, endodermis; pe, pericycle; st, stele.

