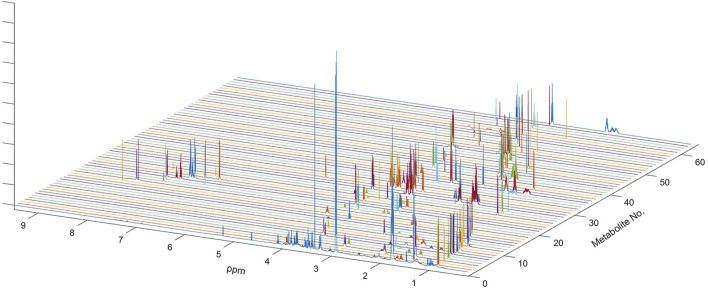
FIGURE 1.
NMR spectrum of metabolites used for multi-linear regression analysis of the global spectrum. Sixty-three metabolites used in the analysis included all metabolites previously determined in the HMDB and also confirmed on the Chenomx NMR Suite. One-dimensional spectra of all sixty-three metabolites are shown along with the outline of the average spectrum for the serum sample. Complete spectra of all metabolites were used in multivariate linear regression analysis.

