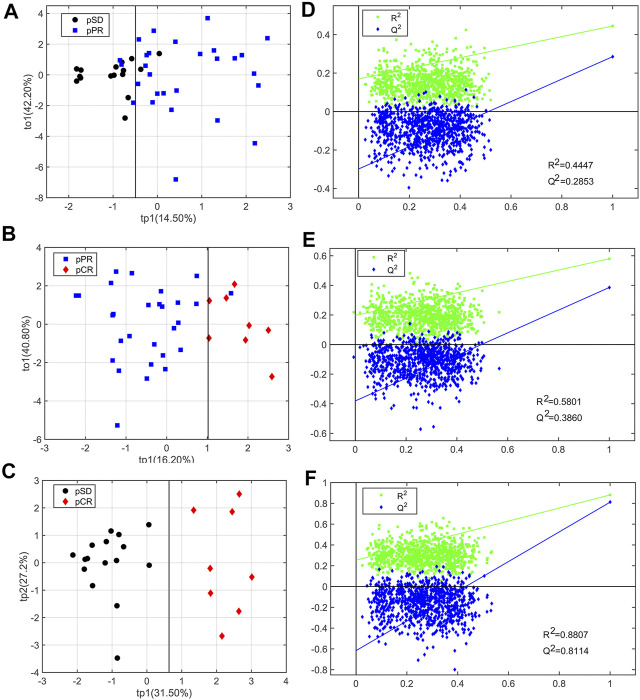
FIGURE 3.
OPLS-DA score plots and corresponding permutation tests of the relative concentration of metabolites’ data from three groups of TNBC patients: (A, D) pSD patients vs. pPR patients; (B, E) pSD patients vs. pCR patients; (C, F) pPR patients vs. pCR patients. In the RPT plots, the green square is R2 (cum), denoting the explained variance of the model. The blue diamond is Q2 (cum), standing for the predictive ability of the model.

