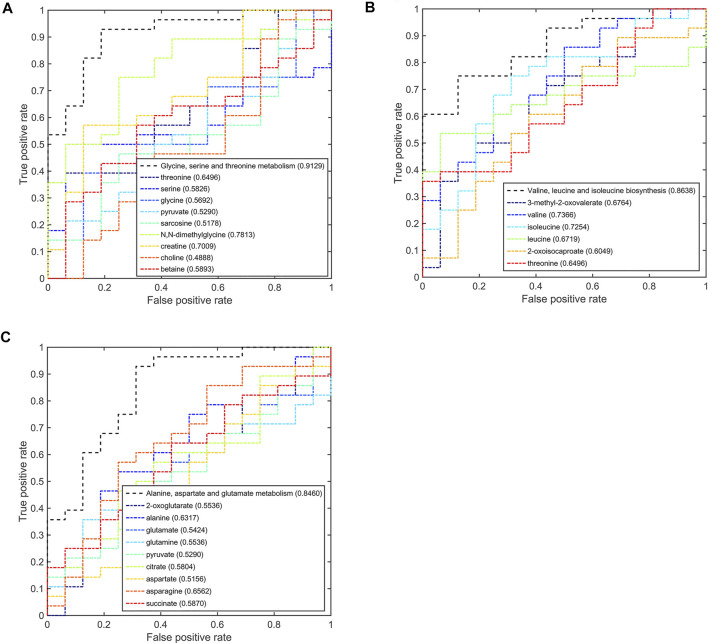
FIGURE 6.
Multi-ROC curves assessing discriminant capabilities of the significantly disturbed metabolic pathways in the pPR patients compared with the pSD patients. The AUC values shown in brackets are used to evaluate the performances of various biomarker models: (A) glycine, serine, and threonine metabolism; (B) valine, leucine, and isoleucine biosynthesis; (C) alanine, aspartate, and glutamate metabolism.

