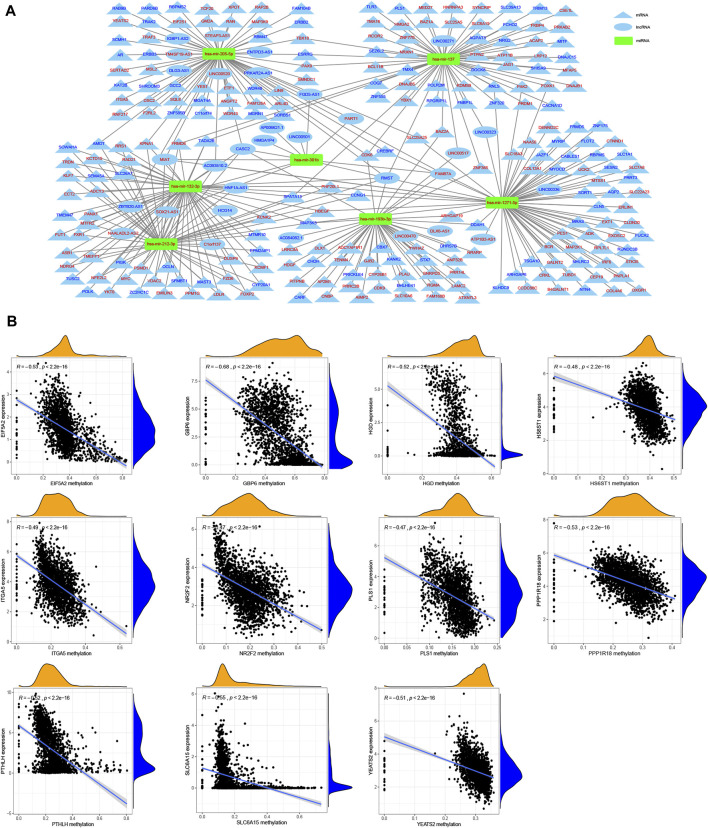
FIGURE 9.
Construction of ceRNA network and identification of methylation driver genes. (A) CeRNA network shows the associations between the targeted lncRNAs (oval) and mRNAs (triangle) of miRNAs (rectangular) related to the tumor pathogenesis of smoking, in which red denotes up-regulation while blue indicates down-regulation. (B) Correlation analysis of gene expression and its methylation level.

