Fig. 1.
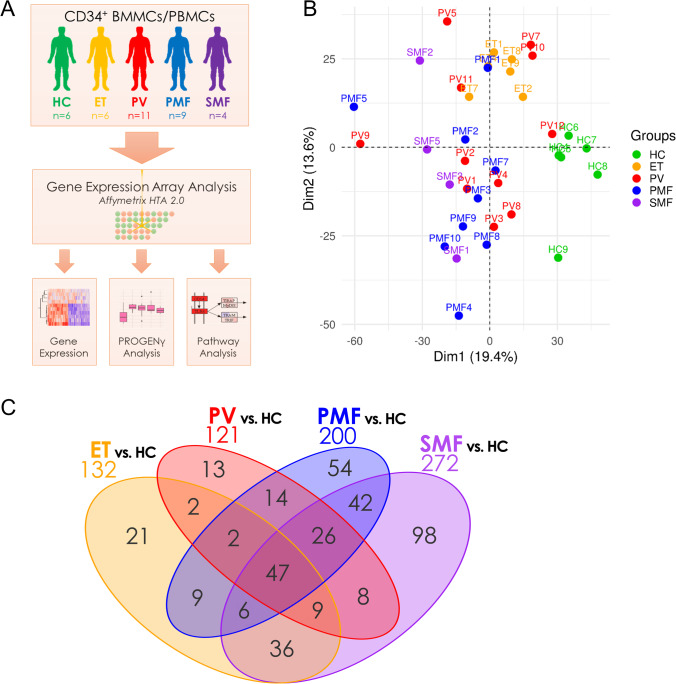
Distinct gene expression profiles of CD34+-enriched MNCs from ET, PV, PMF, and SMF patients and HC. A Experimental design of the study. Patient-derived BMMCs and PBMCs were isolated from BM aspirations or PB samples by density gradient centrifugation and enriched for the CD34+ population by magnetic cell sorting. The isolated RNA was analyzed using the Affymetrix HTA 2.0 platform and analyzed regarding gene expression, Pathway RespOnsive GENes (PROGENy), and enriched KEGG pathways and gene ontologies. B Unsupervised principal component analysis (PCA) of gene expression data between the different MPN samples and HCs. C Venn diagram of the differentially expressed genes (p < 0.05 and |FC|> 1.5). A list of all comparisons is given in Supplemental Table 4. BMMCs, bone marrow mononuclear cells; ET, essential thrombocythemia; HC, healthy controls; MNCs, mononuclear cells; PMF, primary myelofibrosis; PBMCs, peripheral blood mononuclear cells; PV, polycythemia vera; SMF, secondary myelofibrosis

