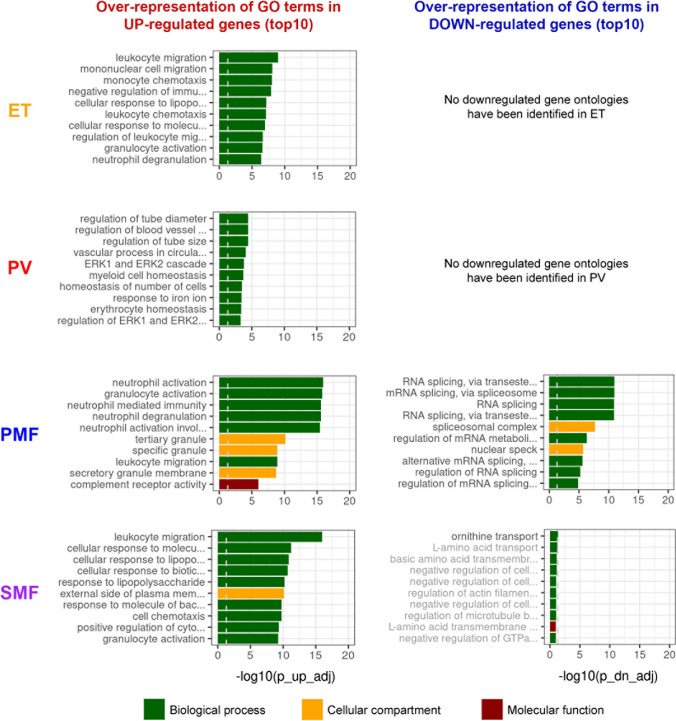
Fig. 3.
Gene ontology (GO) analysis in MPN patient- vs. HC-derived CD34+ cells. GO terms analysis of biological processes (green), and cellular components (yellow), and molecular functions (red). Graphs show the 10 most significantly enriched ontologies with over-representation of GO terms in up- (left) or downregulated (right) genes vs. HC, ranked by adj. p-value. GO terms were restricted to terms with less than 500 genes. A list of all deregulated GO terms including gene numbers and p-values is provided in Supplemental Table 5. ET, essential thrombocythemia; HC, healthy controls; PMF, primary myelofibrosis; PV, polycythemia vera; SMF, secondary myelofibrosis

