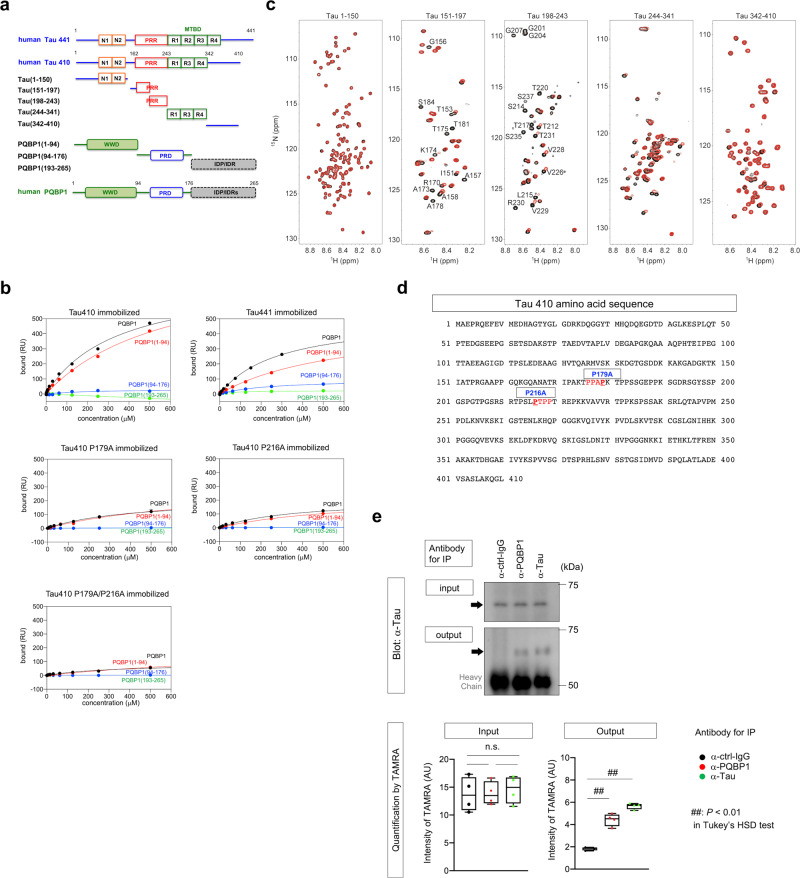
Fig. 1. PQBP1 interacts with extrinsic Tau in microglia.
a Schematic presentation of deletion mutants of tau and PQBP1 used for SPR and NMR analyses. N1/2 N-terminal domain, R1/2/3/4 C-terminal microtubule-binding domain, PRR proline-rich region, WWD WW domain, PRD polar amino acid-rich domain, IDP/IDR intrinsically disordered region. b Equilibrium binding curves of PQBP1 to Tau 410, Tau 441, Tau 410 P179A, Tau 410 P216A, and Tau 410 P179A/P216A monitored by SPR. Tau proteins were immobilized on sensor chip surfaces. The binding response at equilibrium was plotted against the concentration of PQBP1. Black, full-length PQBP1; red, PQBP1(1–94); blue, PQBP1 (94–176); green, PQBP1 (193–265). RU resonance unit. c 1H-15N HSQC spectra of Tau 1–150, 151–197, 198–243, 244–341, and 342–410 in the absence (black) and presence (red) of PQBP1(1–94). Amino acid residue numbers of tau are based on Tau 410. The molar ratio of Tau:PQBP1 (1–94) is 1:5. Residues showing significant chemical shift perturbation and line broadening of resonances are labeled in the HSQC spectra of Tau 151–197 and 198–243. Ctrl control, ppm parts per million. d Tau 410 amino acid sequence showing consensus motifs for interaction with PQBP1-WWD (red letter) and mutated prolines (underlined). e A representative western blot showing co-precipitation of tau with PQBP1 from a lysate of C57BL/6 microglia cultured for 3 days with 25 nM non-aggregated Tau-TAMRA (upper panels). Quantitative immunoprecipitation was performed with C57BL/6 microglia cultured for 3 days with 25 nM non-aggregated Tau-TAMRA. Input was the intensity of TAMRA-labeled Tau 410 in the C57BL/6 microglia lysate samples used for immunoprecipitation. Output was the intensity of TAMRA-labeled Tau 410 in samples after immunoprecipitation with anti-tau, anti-PQBP1, and human IgG. The fluorescence intensity of TAMRA-labeled Tau 410 was measured on a FLUOstar OPTIMA-6 microplate reader. n.s. not significant, AU arbitrary unit. N = 4 per group. P = 0.9963 (ctrl-IgG vs PQBP1), 0.8874 (ctrl-IgG vs tau), 0.9215 (PQBP1 vs tau), 9.63e−6 (PQBP1 vs ctrl-IgG), 3.69e−7 (tau vs ctrl-IgG). ##P < 0.01, n.s.P > 0.05 in Tukey’s HSD test. Box plots show the median, quartiles, and whiskers that represent data outside the 25th to 75th percentile range.

