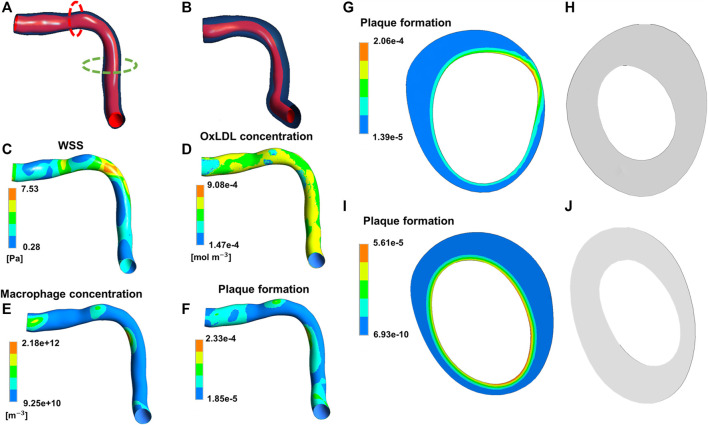
FIGURE 11.
Results of the continuum-based modeling framework of atherosclerosis by Pleouras et al. (2020). Panels (A,B) depict the artery geometry reconstructed at the initial condition and follow-up, respectively. The contour maps of wall shear stress (WSS) (C), oxidized low-density lipoproteins (LDLs) (D), macrophages (E) and plaque formation input (F) at the initial condition are shown. Panels (G,H) refer to the red dashed line in (A) with the initial input of plaque formation (G) and the computed output cross-section (H). Panels (I,J) refer to the green dashed line in (A) with the initial input of plaque formation (I) and the computed output cross-section (J). Adapted with permission from Pleouras et al. (2020) (http://creativecommons.org/licenses/by/4.0/).

