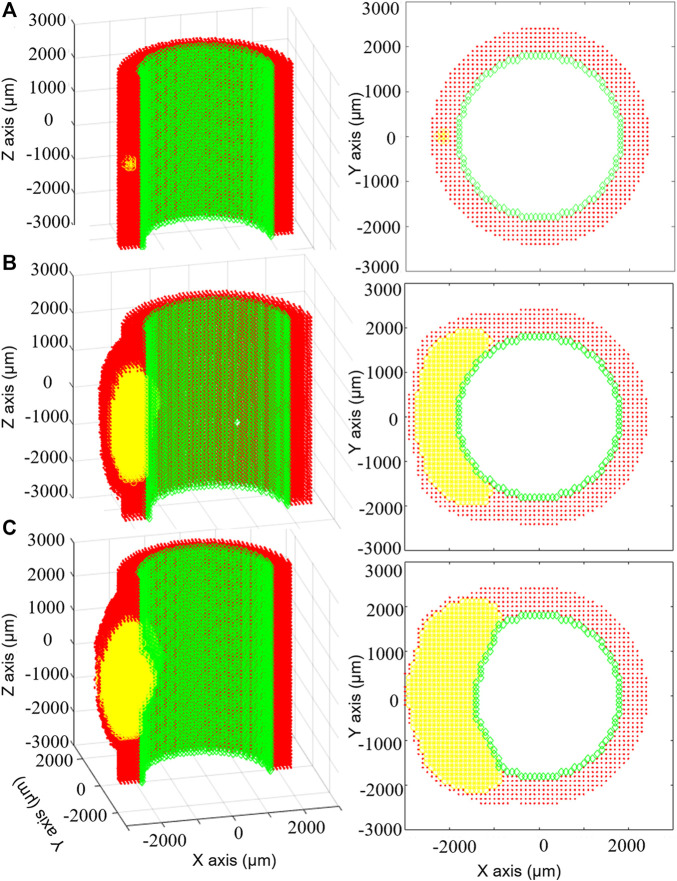
FIGURE 5.
Results of the multiscale computational fluid dynamics–agent-based model (CFD-ABM) framework of atherosclerosis by Bhui and Hayenga (2017). The temporal evolution of the ABM geometry from the initial configuration (A) to the configuration at 6 months (B) and at 7 months (C) is shown, for the longitudinal (left) and transverse (right) views, with the endothelial cells in green, the arterial cells in red and leukocytes in yellow. The initial condition (A) is characterized by the presence of 15 leukocytes in the arterial wall. Until 6 months (B), thanks to the compensatory Glagov’s remodeling, the plaque growth determined an outward remodeling, while preserving the lumen area. At this point, the plaque area is 40%. At 7 months (C), the plaque growth provokes a reduction of the lumen area. Reprinted with permission from Bhui and Hayenga (2017) (http://creativecommons.org/licenses/by/4.0/).

