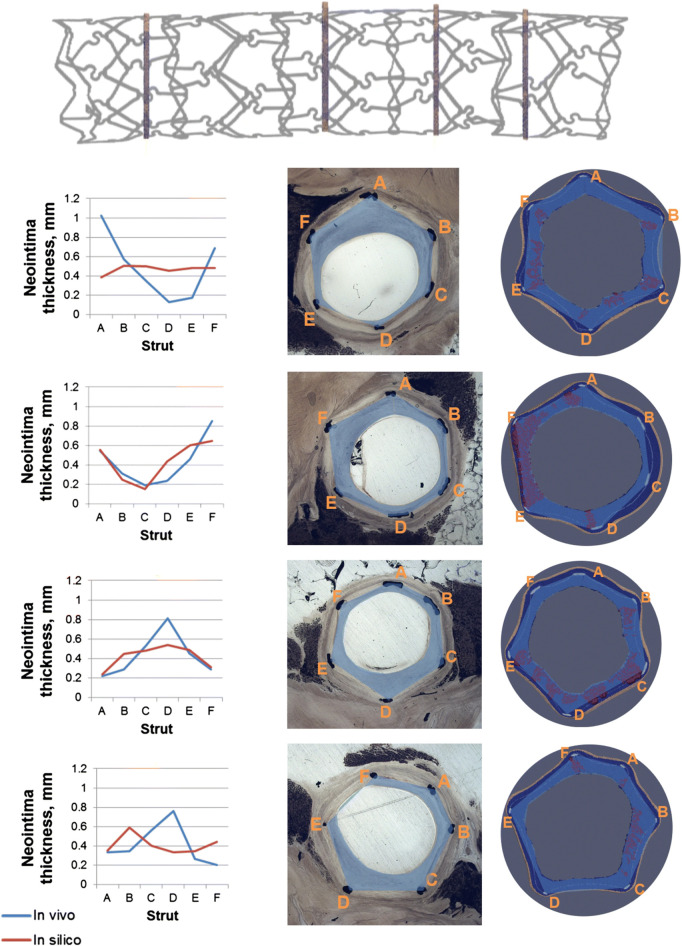
FIGURE 7.
Results of the multiscale agent-based modeling framework of in-stent restenosis of Zun et al. (2019). At the top, the stent geometry is shown, with indications on the position of the four analyzed cross-sections. At the bottom, the results at 28 days are shown for the four cross-sections. For each cross-section: 1) on the left, a quantitative comparison of the predicted (in-silico) and in-vivo neointimal thickness is provided for the 6 struts locations (A–F), 2) in the middle, the in-vivo cross-section is shown and 3) on the right, the in-silico cross-section is represented, with the smooth muscle cells (SMCs) in dark blue, the internal elastic lamina (IEL) in light blue, the external elastic lamina (EEL) in beige, the extracellular matrix (ECM) in red and the stent struts in light grey. Both in the in-vivo and in-silicosilico cross-sections the blue area represents the neointima estimation. Reprinted with permission from Zun et al. (2019) (http://creativecommons.org/licenses/by/4.0/).

