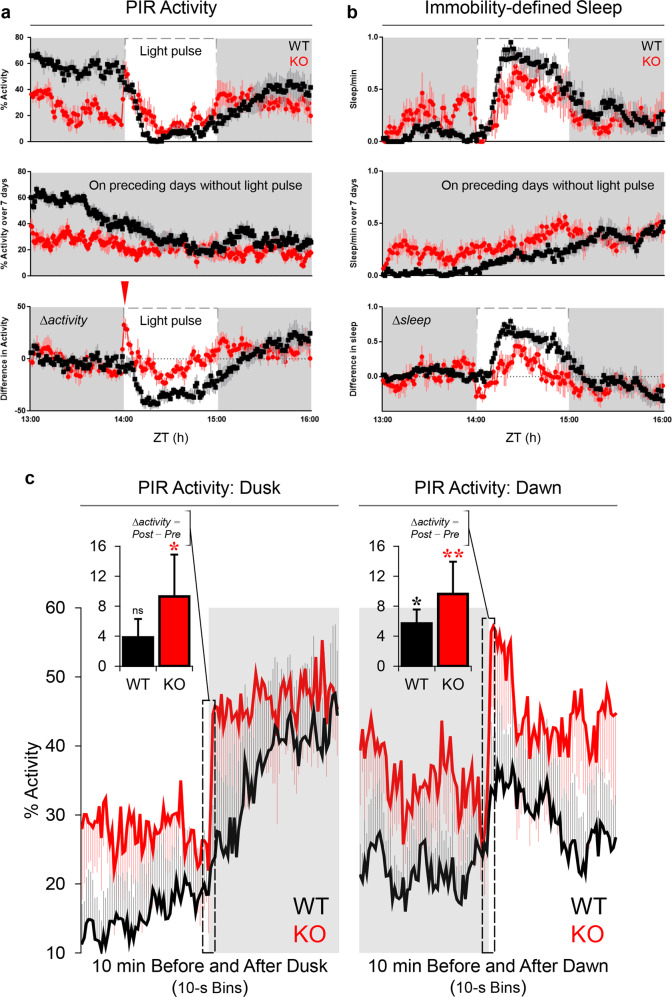
Fig. 3. Behavioural responses to nocturnal light pulses and to dusk and dawn transitions.
a PIR activity (averaged across three replicates, as 1-min bins) in response to a 1-h light pulse, which is indicated by the dashed line. Overall activity (top) compared to average activity at the same time of day (ZT13–16) on the seven days prior to the 1st light pulse (middle), to give the change in activity (∆activity) in response to the light pulse (bottom). The red inverted triangle indicates the sharp but transient spike of PIR activity immediately following the onset of the light pulse in GluA1 knockouts. b Similar examination of changes in the proportion of time spent asleep, where sleep was defined as ≥40 s of PIR inactivity. Light-induced sleep was attenuated in GluA1 knockouts (main effect of Genotype on ∆sleep from ZT14–15, p < 0.05; bottom). c PIR activity changes in response to dusk (i.e. the transition from light to dark; left) and dawn (i.e. the transition from dark to light; right). Data were pooled across 8 days of 12:12 LD. Changes in locomotor activity at dusk and dawn were exaggerated in GluA1-knockout animals (two min before vs. two min after dusk: Genotype × Time Bins interaction p = 0.004; main effect of Genotype p = 0.343; two min before vs. two min after dawn: Genotype × Time Bins interaction p < 0.001; main effect of Genotype p = 0.267). c, insets In wild-type animals (black) only small and gradual changes in locomotor activity were observed at dusk and dawn (10 s before vs. 10 s after dusk: mean ∆activity = +3.84%, p = 0.169; 10 s before vs. 10 s after dawn: mean ∆activity = +5.70%, p = 0.023; black asterisk). By contrast, sharper and exaggerated responses to dusk and dawn were found in GluA1-knockout animals (red; 10 s before vs. 10 s after dusk: mean ∆activity = +9.30%, p = 0.02; red asterisk; 10 s before vs. 10 s after dawn: mean ∆activity = +9.63%, p = 0.008; double red asterisks). A Genotype × Phase (Dusk and Dawn) ANOVA showed a main effect of Genotype on ∆activity scores (p = 0.037), confirming the increased sensitivity to light/dark transitions in GluA1-knockout animals.

