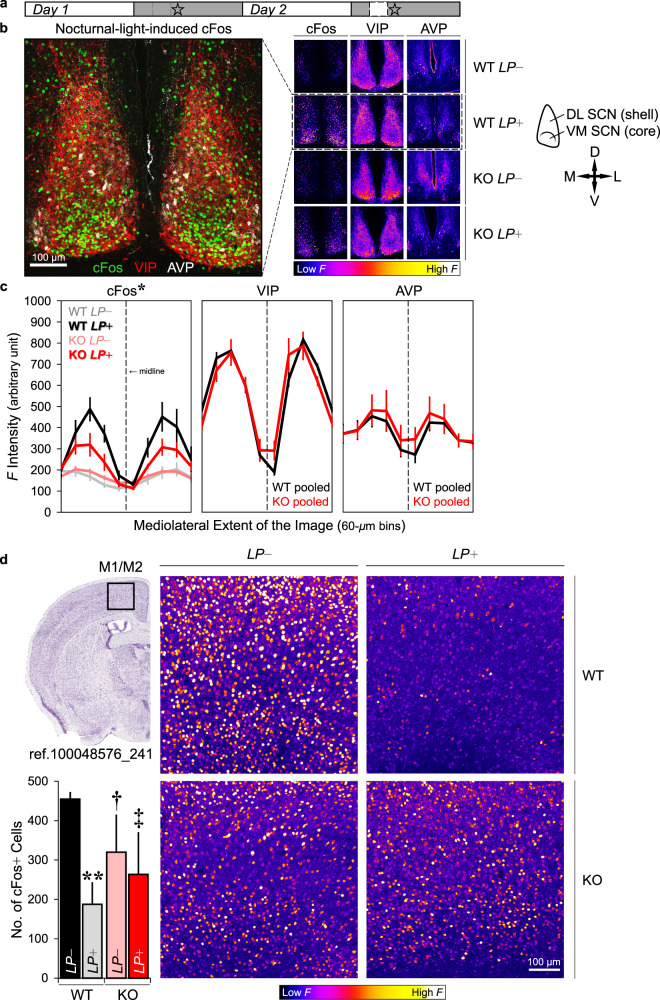
Fig. 4. Immunofluorescence cFos, VIP, and AVP signals.
a A schematic depicting the timeline of the experiment: For half of the animals (n = 3 wild-type and three GluA1 KO mice), no light pulse was given prior to perfusion and they were perfused at ~ZT15.5 (day 1, LP−); the remaining animals perfused on day 2 (n = 3 wild-type and three GluA1 KO mice) received a nocturnal light pulse (LP+) which started at ZT14. Star symbols indicate the Zeitgeber time of perfusion, which was ~90 min after the onset of the nocturnal light (~ZT15.5). Thus, the ZTs at which perfusion was performed were matched between LP− and LP+ conditions. b Representative images of immunofluorescence cFos, VIP, and AVP staining in the SCN (scale bar = 100 μm). In the middle multi-panels, brighter colours indicate higher immunofluorescence (F) intensity, whereas darker colours indicate lower F intensity. A schematic delineating the core (ventromedial) vs. shell (dorsolateral) subregions of the SCN is shown on the right (D dorsal, V ventral, M medial, and L lateral). c Mean F intensities (±standard errors of the mean) from all three channels across the entire mediolateral extent of the SCN. Nocturnal-light-induced cFos signals were attenuated in GluA1 knockouts (*two-way ANOVA for LP+ conditions, Genotype × Mediolateral Extent interaction p = 0.019). VIP and AVP data were pooled across LP− and + LP (n = 6 per genotype). The vertical dashed lines represent the location of the midline, and the 60-μm bins adjacent to the dashed lines (i.e. the middle two bins with the lowest F intensities) are the location of the 3rd ventricle. d Example images of immunofluorescence cFos staining in the motor cortex, area M1/M2 (scale bar = 100 μm). The image of the Nissl-stained coronal section on the left was retrieved from the Allen Mouse Brain Atlas, plate reference number 100048576_241 [125]. The number of cFos+ cells in M1/M2 of wild-type animals, but not GluA1 knockouts, was reduced in response to nocturnal light (**p < 0.01). Variability in cFos+ cell count in KO LP− and KO LP+ conditions (pink and red bars) was higher than that in the WT LP− condition (black bar), as indicated by Levene’s tests for equality of variances (†p < 0.05; ‡0.05 < p < 0.06).

