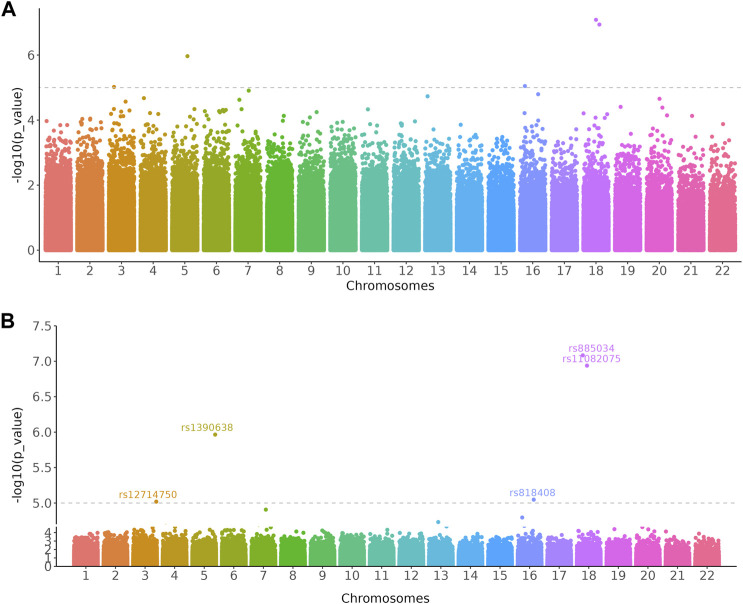
FIGURE 3.
Manhattan plots showed loci significantly associated with the relative abundance of gut bacterial diversity using Chao1 index from 541 East Asians. (A) Original Manhattan plot. (B) Manhattan plot with significant region zoomed in. The dashed line represents a genome-wide suggestive level (p = 1 × 10⁻⁵). The GWAS data was downloaded from the GWAS Catalog database (Study accession: GCST90007012).

