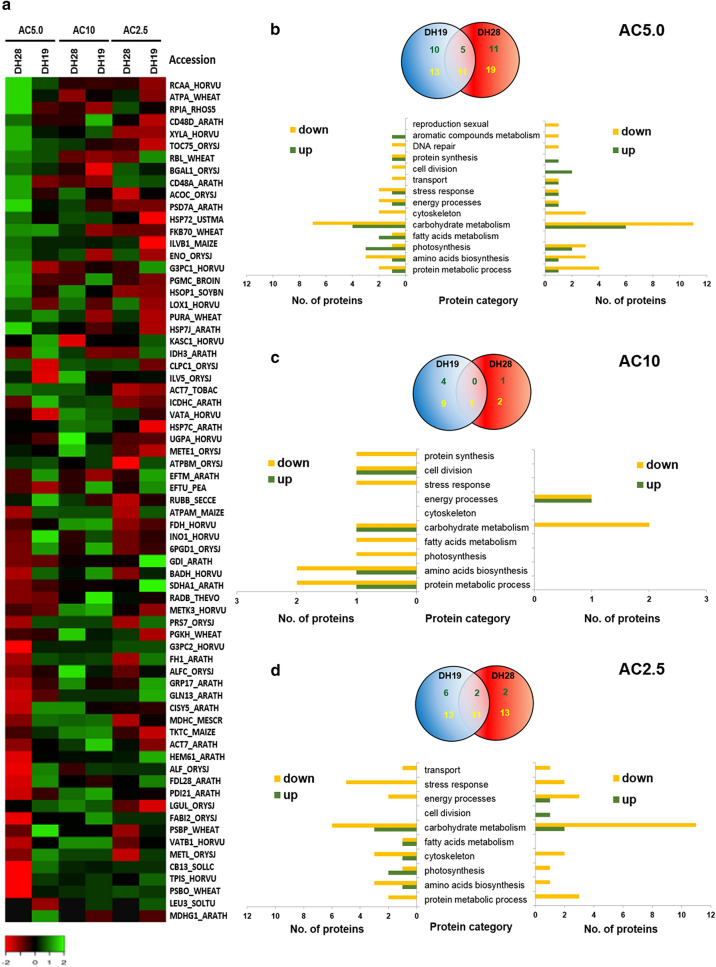
Figure 3.
Effect of 5-azacytidine (AC) on protein abundance identified in the anthers of two doubled haploid (DH) lines of triticale, significantly differed in their responsiveness to microspore embryogenesis (responsive DH28 and recalcitrant DH19). AC was applied at concentrations of 2.5 µM (AC2.5), 5.0 µM (AC5.0) and 10 µM (AC10) during low temperature tillers treatment. (a) Heat map showing differentially expressed proteins identified after AC treatment. The heatmap was constructed using Heatmapper accessible at http://www.heatmapper.ca/expression/. Colours correspond to the log transformed values of protein fold-change. Accession numbers of identified proteins are presented in Supplementary Table S4. The proteins were ordered according to the fold change after AC5.0 treatment in the responsive line DH28. (b–d) Venn diagrams shows the number and overlap of protein spots showing quantitative changes in their abundance in comparison to the control (3 weeks at 4 °C) after AC5.0 (b), AC10 (c) and AC2.5 (d) treatments while graphs depicts their functional classification. Quantitative Venn diagrams were constructed using a web application BioVenn accessible at http://www.biovenn.nl/index.php, but the original colours of the graphs were modified. Green font colour is used for the number of up-regulated and yellow font for down-regulated proteins.

