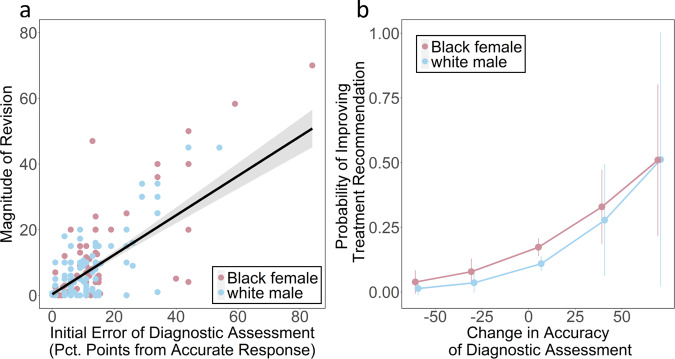
Fig. 2. Revision dynamics drive improvements to diagnostic assessments and treatment recommendations.
Panel a shows clinicians’ propensity to revise their diagnostic assessments in the network conditions according to the initial error in their diagnostic assessments. Clinicians’ accuracy is represented as the absolute number of percentage points of a given assessment from the most accurate assessment of 16% (represented by 0 along the x-axis, indicating a distance of 0 percentage points from the most accurate response). Magnitude of revision is measured as the absolute difference (percentage points) between a clinician’s initial diagnostic assessment and their final diagnostic assessment. Clinicians’ accuracy in their initial assessment significantly predicts the magnitude of their revisions between the initial to final response. Grey error band displays 95% confidence intervals for the fit of an OLS model regressing initial error of diagnostic assessment on magnitude of revision. Panel b shows the significant positive relationship between the improvement in clinicians’ diagnostic accuracy (from the initial to final assessment), and their likelihood of improving in their treatment recommendation (i.e. the probability of switching from recommending Option A, B, or D to Option C) for clinicians in the network conditions. The trend line shows the estimated probability of clinicians improving their treatment recommendations according to a logistic regression, controlling for an interaction between experimental condition (control or network) and patient-actor demographic (Black female or white male) (Supplementary Table 9). Error bars show standard errors clustered at the trial level.

