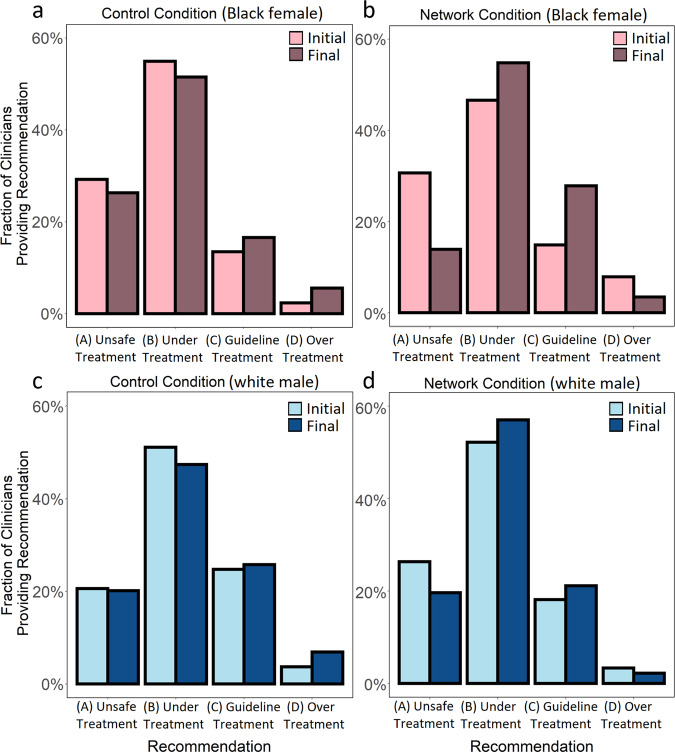
Fig. 3. Change (from initial response to final response) in the urgency of clinical recommendations in both the control and network condition.
Each panel shows the fraction of clinicians providing each treatment recommendation at the initial and final response, averaged first within each of the trials in each condition (N = 7), and then averaged across trials. Option A. 1 week follow-up (unsafe undertreatment). Option B. Stress test in 2–3 days (undertreatment). Option C. Immediate emergency department evaluation (guideline-recommended treatment). Option D. Immediate cardiac catheterization (overtreatment Panel a shows the change in control condition recommendations for the Black female patient-actor (initial recommendations light pink, final recommendations dark pink). Panel b shows the change in network condition recommendations for the Black female patient-actor (initial recommendations light pink, final recommendations dark pink). Panel c shows the change in control condition recommendations for the white male patient-actor (initial recommendations light blue, final recommendations dark blue). Panel d shows the change in network condition recommendations for the white male patient-actor (initial recommendations light blue, final recommendations dark blue).

