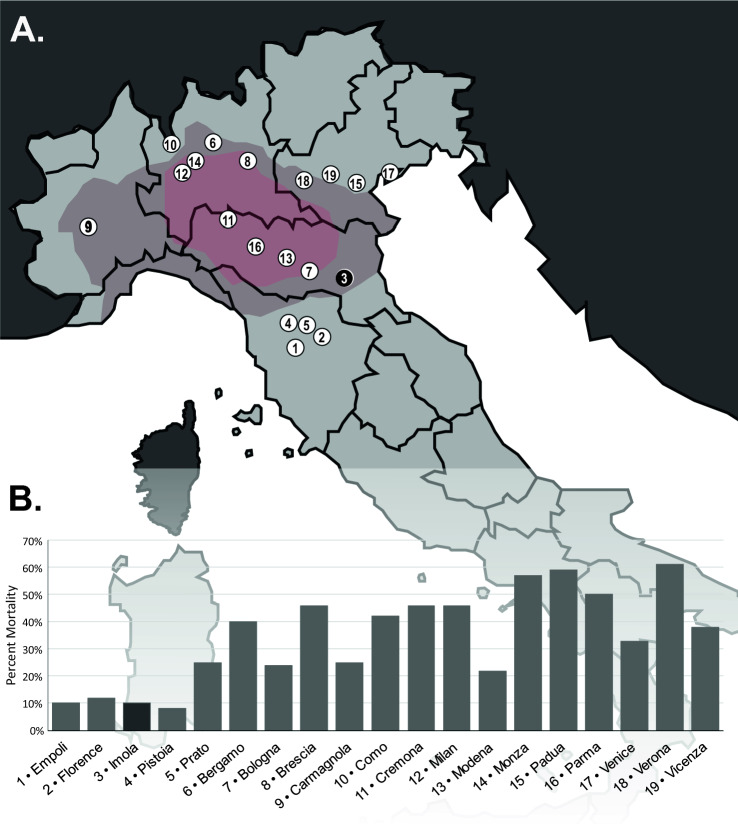
Figure 1.
The plague of 1630–1632 in Northern and Central Italy. (A) Map of Northern and Central Italy showing the cities recorded on (B). Areas known to have been affected by the famine of 1628–1629 are marked in red and areas speculated to have been affected in grey-red. The site of Imola is marked in black. Vector basemap from Wikimedia Commons (Carte ITALIE R1, 2018). (B) Mortality rates for cities marked in (A) (as reported in Cipolla 2012). The mortality rate for the city of Pistoia was revised according to the data detailed in Cipolla 1981. (The vector basemap was modified from “Carte ITALIE R1” by Wikisoft on Wikimedia Commons 5 licensed under CC BY-SA 3.0 license).

