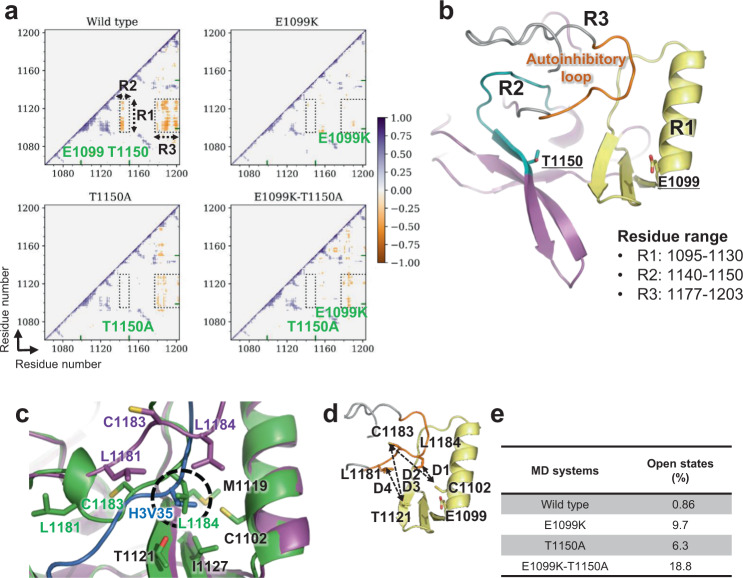
Fig. 5. Opening and closing of the autoinhibitory loop.
a 2D plots of the cross-correlation of residue-wise fluctuations in the NSD2 wild-type, E1099K, T1150A, and double mutant E1099K-T1150A proteins. All the correlation coefficients between −0.3 and 0.3 were taken as zero to visualize the significantly correlated residues. The regions labeled R1 (residues 1095–1130), R2 (residues 1140–1150), and R3 (post-SET loop) exhibit a remarkable difference between the wild-type and mutants. The mutation sites are denoted by green ticks on the axis. b The regions R1 (pale yellow), R2 (teal), R3 (gray), the autoinhibitory loop (orange) in R3 and the mutation sites (stick view), are shown and labeled on the NSD2 SET domain structure. c Superimposition of H3-free NSD2 (green) and nucleosome-bound NSD2 (magenta). H3 is shown in marine blue. The overlapping hydrophobic cavity occupied by the L1184 residue in substrate-free NSD2 and H3V35 is circled in black. d Definition of four distance-based locks (D1: L1184–C1102, D2: C1183–C1102, D3: C1183–T1121, and D4: L1181–T1121), as represented by dashed lines in the SET domain structure. The autoinhibitory loop is shown in orange, and residues are labeled. e Table showing the percentage of open autoinhibitory loop conformations observed under different conditions.

