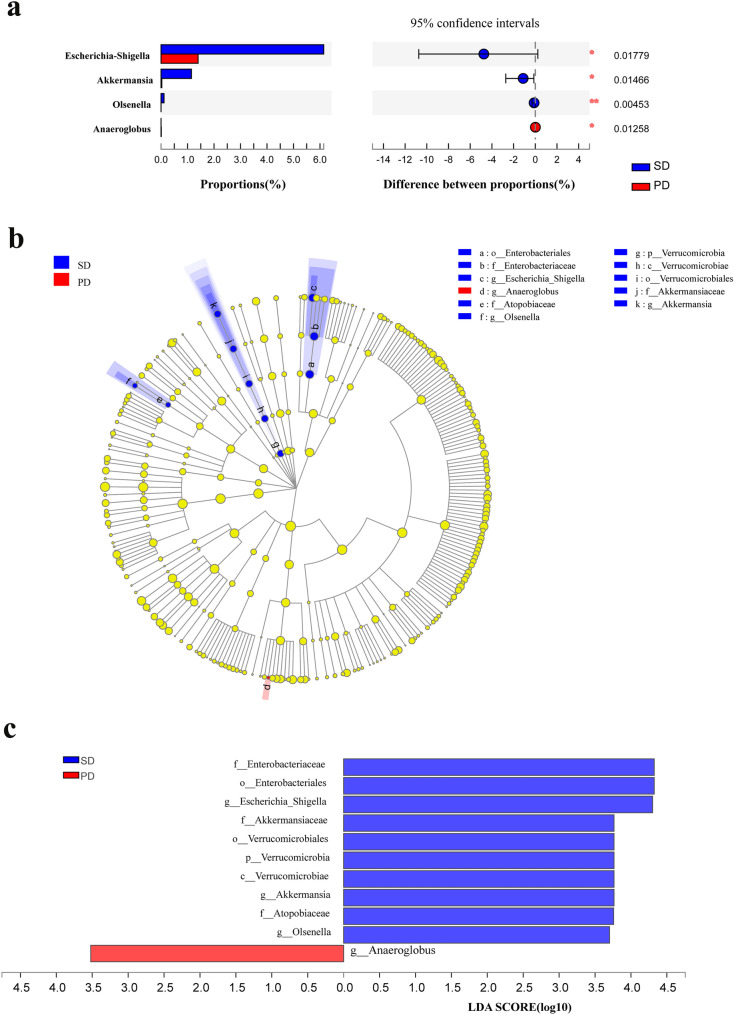
Fig. 3.
Differences in the relative abundance of genera in SD and PD patients. a Kruskal–Wallis H test analysis for the assessment of significance in differences in relative abundance at the genus level in the SD (blue) and PD groups (red). b Multi-level species difference discriminant analysis (LEfSe) identifies the features of different abundance and associated categories in the SD (blue) and PD groups (red). c Linear discriminant analysis (LDA) identifies communities or species with a significant differential impact on sample delineation in SD (blue) and PD groups (red). *P < 0.05; **P < 0.01; ***P < 0.001

