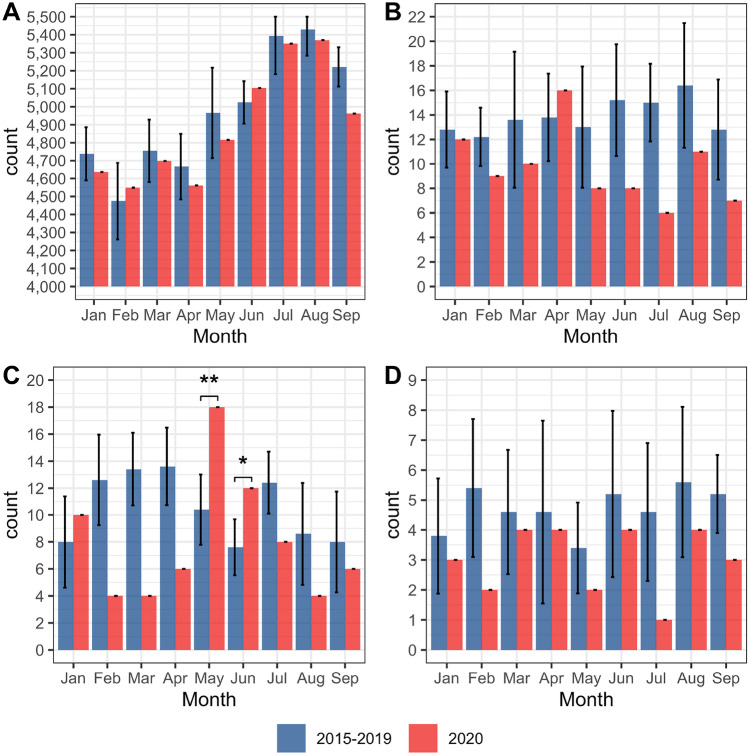
Fig. 2.
Mean number of live births and stillbirths per month, from January to September. 2015–2019 (blue; error bars represent 1SD) and 2020 (red). A Live births (all gestational ages), B stillbirths (all gestational ages), C live births (extremely preterm, gestational age 22–28 weeks), and D stillbirths (gestational age 22–28 weeks). Statistically significant differences are indicated by asterisks. *represents p ≤ 0.05, and ** represents p < 0.01

